Fig. 9
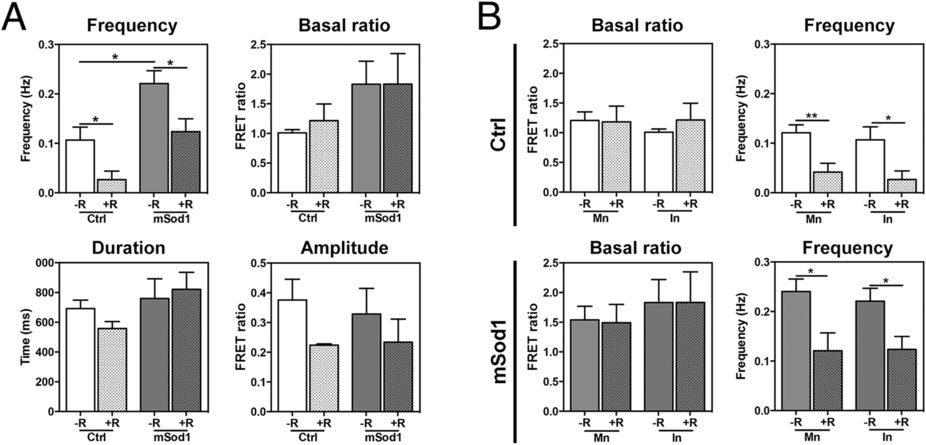
Riluzole treatment reduces spontaneous high-frequency depolarizations in the spinal interneurons of mSod1 embryos.
(A) The basal FRET ratio, and the frequency amplitude and duration of the depolarizations recorded in type 1 interneurons (T1) in riluzole-treated (+R) and untreated (−R) Ctrl and mSod1 embryos. There were no differences in the basal FRET ratio of T1 in Ctrl and mSod1 embryos before (1.01 ± 0.05 vs 1.83 ± 0.39) or after riluzole administration (Ctrl: 1.22 ± 0.28; mSod1: 1.83 ± 0.52). Before riluzole treatment, the T1 in mSod1 embryos showed significantly higher-frequency spontaneous depolarizations than those in Ctrl embryos (0.22 ± 0.03 Hz vs 0.11 ± 0.03 Hz), but the frequency was reduced in both after riluzole treatment (mSod1: 0.12 ± 0.03 Hz; Ctrl 0.01 ± 0.01 Hz), although there was no difference in amplitude (Ctrl: 0.37 ± 0.07 [−R] and 0.22 ± 0.01 [+R]; mSod1: 0.33 ± 0.08 [−R] and 0.23 ± 0.07 [+R]) or duration (Ctrl: 692.4 ± 56.8 ms [−R] and 557.7 ± 47.02 ms [+R]; mSod1: 759.8 ± 131.9 ms [−R] and 821.4 ± 114.2 ms [+R]). (B) Comparison of the basal FRET ratio and spontaneous depolarization frequency recorded in embryonal spinal cord motor neurons (Mn) and interneurons (In). There was no difference in the basal Ctrl and mSod1 motor neuron and T1 interneuron ratio with (+R) or without riluzole (−R), and no difference between the motor neurons and interneurons of Ctrl and mSod1 embryos in spontaneous depolarization frequency or its reduction after treatment. The basal FRET ratio and frequency (Hz) of spontaneous depolarizations were measured in five Ctrl and 16 mSod1 T1 before and after riluzole administration, and their amplitude (FRET Ratio) and duration (ms) were measured in five Ctrl and five mSod1 T1 with (+R) or without riluzole (−R). The columns in each graph indicate the mean value ± SEM of the indicated parameter. The measures were statistically analyzed using an unpaired Student t-test (*P < 0.05; **P < 0.01).
Image
Figure Caption
Figure Data
Acknowledgments
This image is the copyrighted work of the attributed author or publisher, and
ZFIN has permission only to display this image to its users.
Additional permissions should be obtained from the applicable author or publisher of the image.
Full text @ Sci. Rep.

