Fig. 2
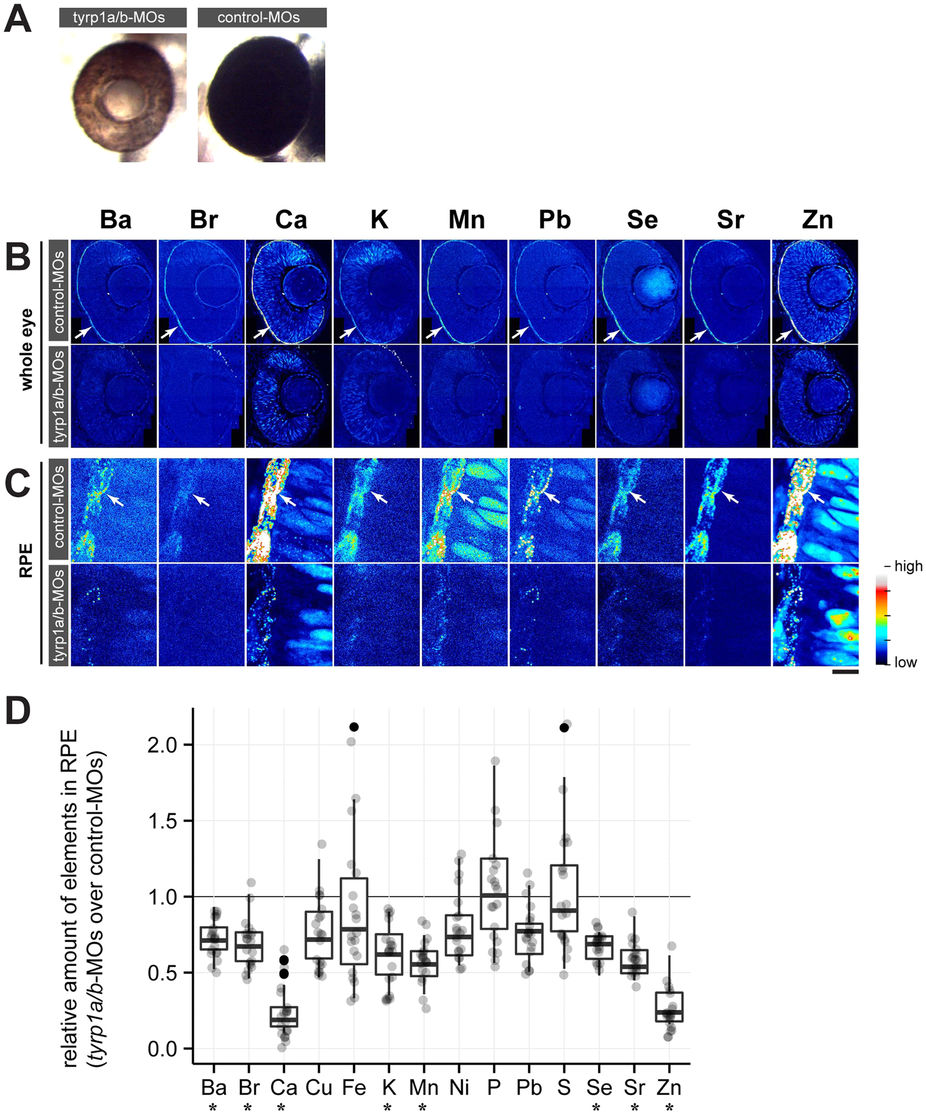
Mature melanosomes are required for enrichment of inorganic elements in the RPE.
(A) Morpholino oligonucleotide (MO)-mediated knockdown of Tyrp1a/b results in the absence of mature melanosomes (brown colour of RPE) at 2 dpf, while control-MO injected embryos form mature melanosomes (black colour of RPE). (B) Distribution of inorganic elements in the eye of 2 dpf embryos injected with control (control-MOs, upper row) or tyrp1a/b-MOs (tyrp1a/b-MOs, lower row). The RPE enrichment of elements (arrow) seen in control-MO injected embryos is not observed in tyrp1a/b-MO injected embryos (n = 3 for each group). Step size: 300 nm/pixel. (C) Images taken with high lateral resolution (100 nm/pixel) showing inorganic element enrichment in individual melanosomes in the RPE (arrow) of embryos injected with control-MOs (upper row). This enrichment is not evident or strongly reduced in tyrp1a/b-knockdown embryos (lower row). Colour scale: Ba 10.0–132.5 ppm; Br 0.1–6.5 ppm; Ca 0–1152 ppm; K 0–623.3 ppm; Mn 0.3–19.6 ppm; Pb 0.7–10.8 ppm; Se 0.3–4.6 ppm; Sr 0.3–19.6 ppm; Zn 0–152.9 ppm. Scale bars: (A,B) 50 μm; (C) 5 μm. (D) The content of each element in the RPE was shown as the ratio of tyrp1a/b morphants to control embryos, with all possible combinations between control MO-injected embryos (n = 4 embryos) and tyrp1a/b MO-injected (n = 5 embryos). Abundance of eight elements (Ba, Br, Ca, K, Mn, Se, Sr and Zn) showed significant reduction in the RPE after knockdown of tyrp1a/b (Mann–Whitney U test; U = 0, *p = 0.0158 for Ba, Ca, K, Mn, Sr and Zn; U = 1, *p = 0.0365 for Br; U = 0, *p = 0.0194 for Se).

