
|
Fig. 3
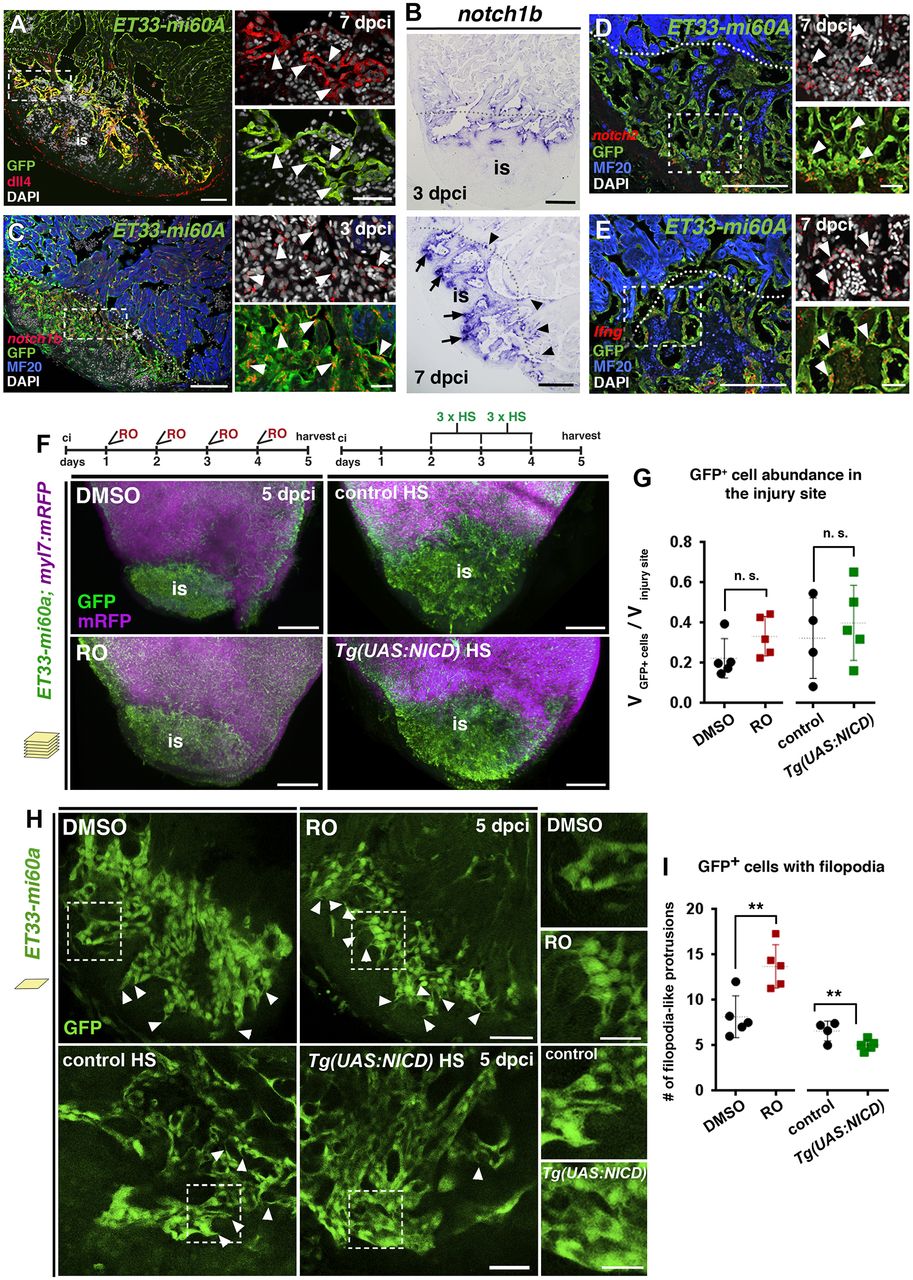
Notch signalling elements are expressed in the endocardium and Notch signalling modulation affects injury endocardium maturation. (A) IHC showing Dll4 expression by GFP+ wound endocardial cells (arrowheads). (B) ISH showing notch1b expression in endocardial cells at the injury site (arrows) and lining injury-adjacent cardiomyocytes (arrowheads). (C-E) FISH for notch1b (C), notch2 (D) or lfng (E) combined with IHC showing transcripts in GFP+ wound endocardial cells (arrowheads). (F) Volume rendering of injured ET33-mi60a;myl7:mRFP ventricles after DMSO or RO treatment and of heat shocked (HS) Tg(UAS:NICD);ET33-mi60a;myl7:mRFP and control hearts. Treatment regimens are indicated at the top. (G) Scatter plot presenting relative wound GFP+ cell volume. Mean (dotted line)±s.d.; t-test. (H) Injury site optical sections showing the disorganisation and clustered appearance of endocardial cells and more filopodia-like protrusions (arrowheads) after RO treatment, and fewer filopodia-like protrusions after heat shock in Tg(UAS:NICD);ET33-mi60a;myl7:mRFP hearts. (I) Scatter plot showing the number of filopodia-like protrusions. For representative images used for quantification see Fig. S6A. Mean±s.d.; t-test **P<0.05. Dotted lines (A,C,D,E) delineate the injury site (is). Boxed areas are magnified on the right. Scale bars: 100 µm in A-E; 200 µm in F; 50 µm in H; 20 µm in magnified views in A,C,D,E; 25 µm in magnified views in H.