
|
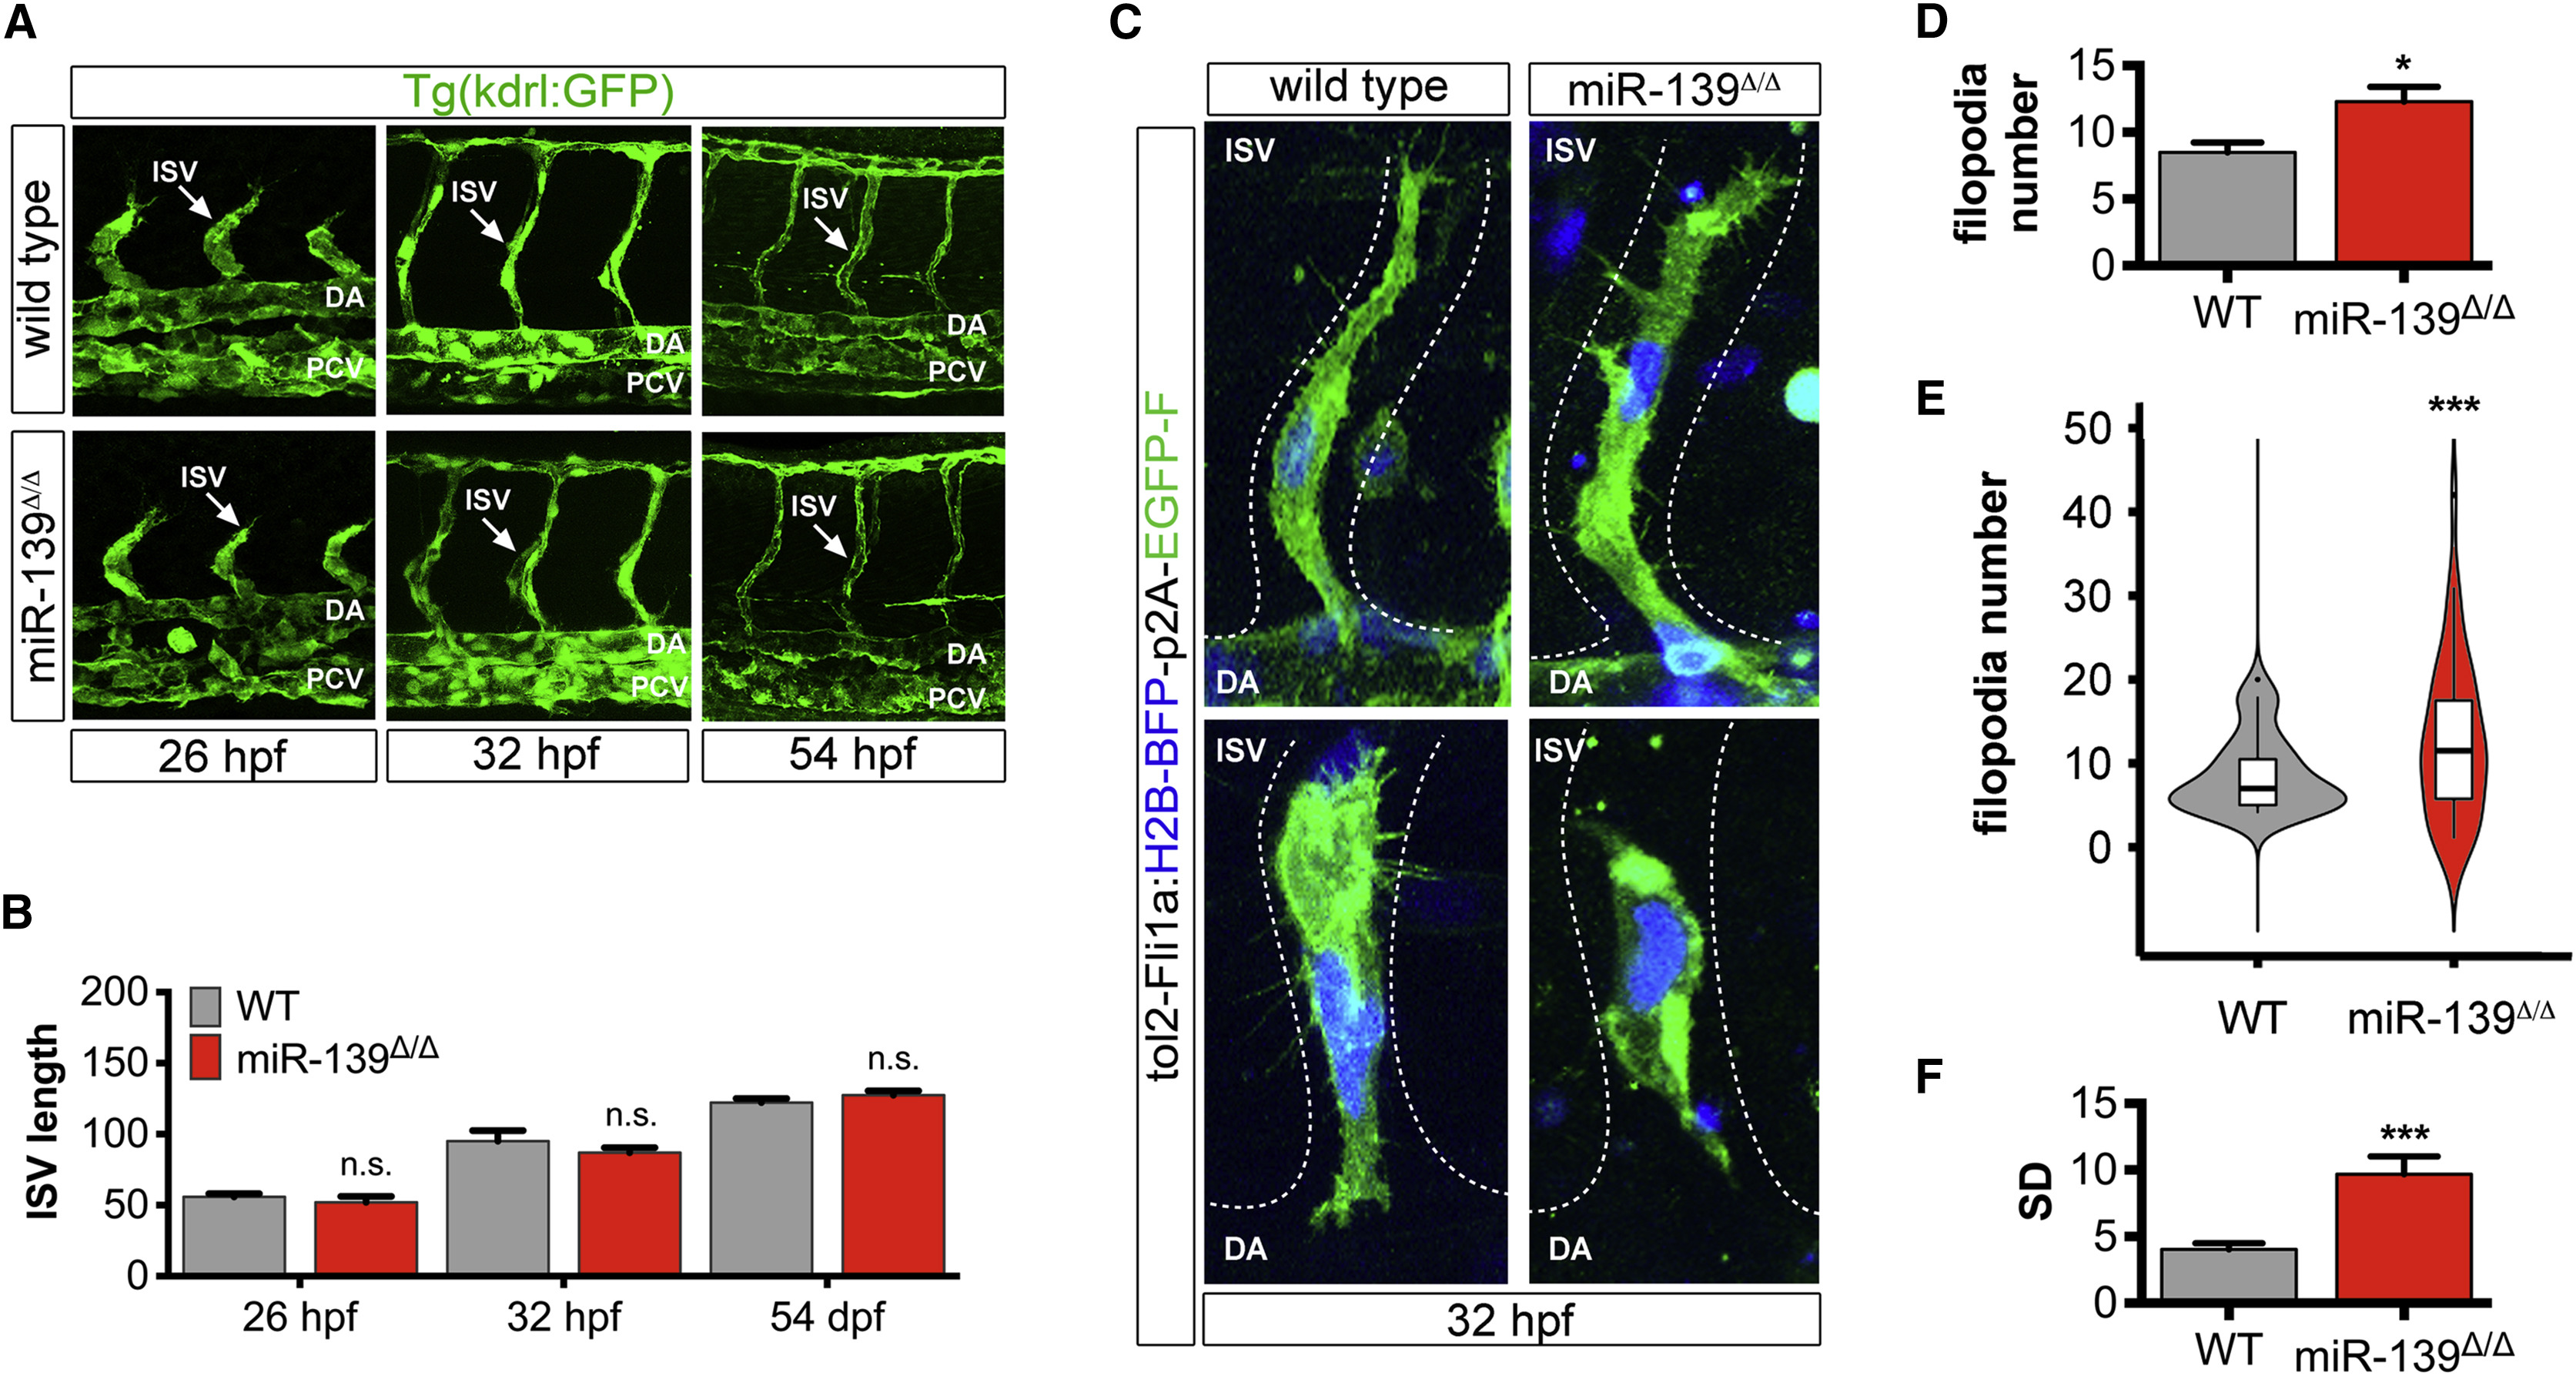
Fig. 3
miR-139 Homozygous Mutants Exhibit Heterogeneity in Endothelial Cell Filopodia Number
(A) Lateral view (25×) of Kdrl:GFP+ trunk vasculature at the indicated developmental stages. Arrows point to ISVs.
(B) Average ISV length (μm) was determined from confocal projections (n = 9–18). Bar plots show mean ± SEM.
(C) Representative images (40×) of single endothelial cells expressing tol2-Fli1a-H2B-BFP-p2A-EGFP-farnesyl vector in wild-type and miR-139Δ/Δ ISVs. miR-139Δ/Δ images depict endothelial cells with excessive (top) or few (bottom) filopodia. Endothelial cell nuclei are in blue and membranes are in green.
(D) Bar plots show the average of replicate means ± SEM of endothelial cell filopodia number (n = 9 replicates).
(E) Violin plots show filopodia number probability density distributions. Solid lines in box plots depict median values. Phenotypic variability was significantly different from wild-type, ∗∗∗p = 9.46 × 10⁻⁴ by Levene's test (n = 36 cells).
(F) Bar plots show average replicate SD ± SEM of endothelial cell filopodia number (n = 9 replicates).
Significance calculations were relative to wild-type embryos. n.s., not significant (p > 0.05); ∗p ≤ 0.05, ∗∗∗p ≤ 0.001, two-tailed Mann-Whitney U test unless otherwise indicated. Abbreviations as defined in Figure 1. See also Figure S3.
Reprinted from Developmental Cell, 40, Kasper, D.M., Moro, A., Ristori, E., Narayanan, A., Hill-Teran, G., Fleming, E., Moreno-Mateos, M., Vejnar, C.E., Zhang, J., Lee, D., Gu, M., Gerstein, M., Giraldez, A., Nicoli, S., MicroRNAs Establish Uniform Traits during the Architecture of Vertebrate Embryos, 552-565.e5, Copyright (2017) with permission from Elsevier. Full text @ Dev. Cell