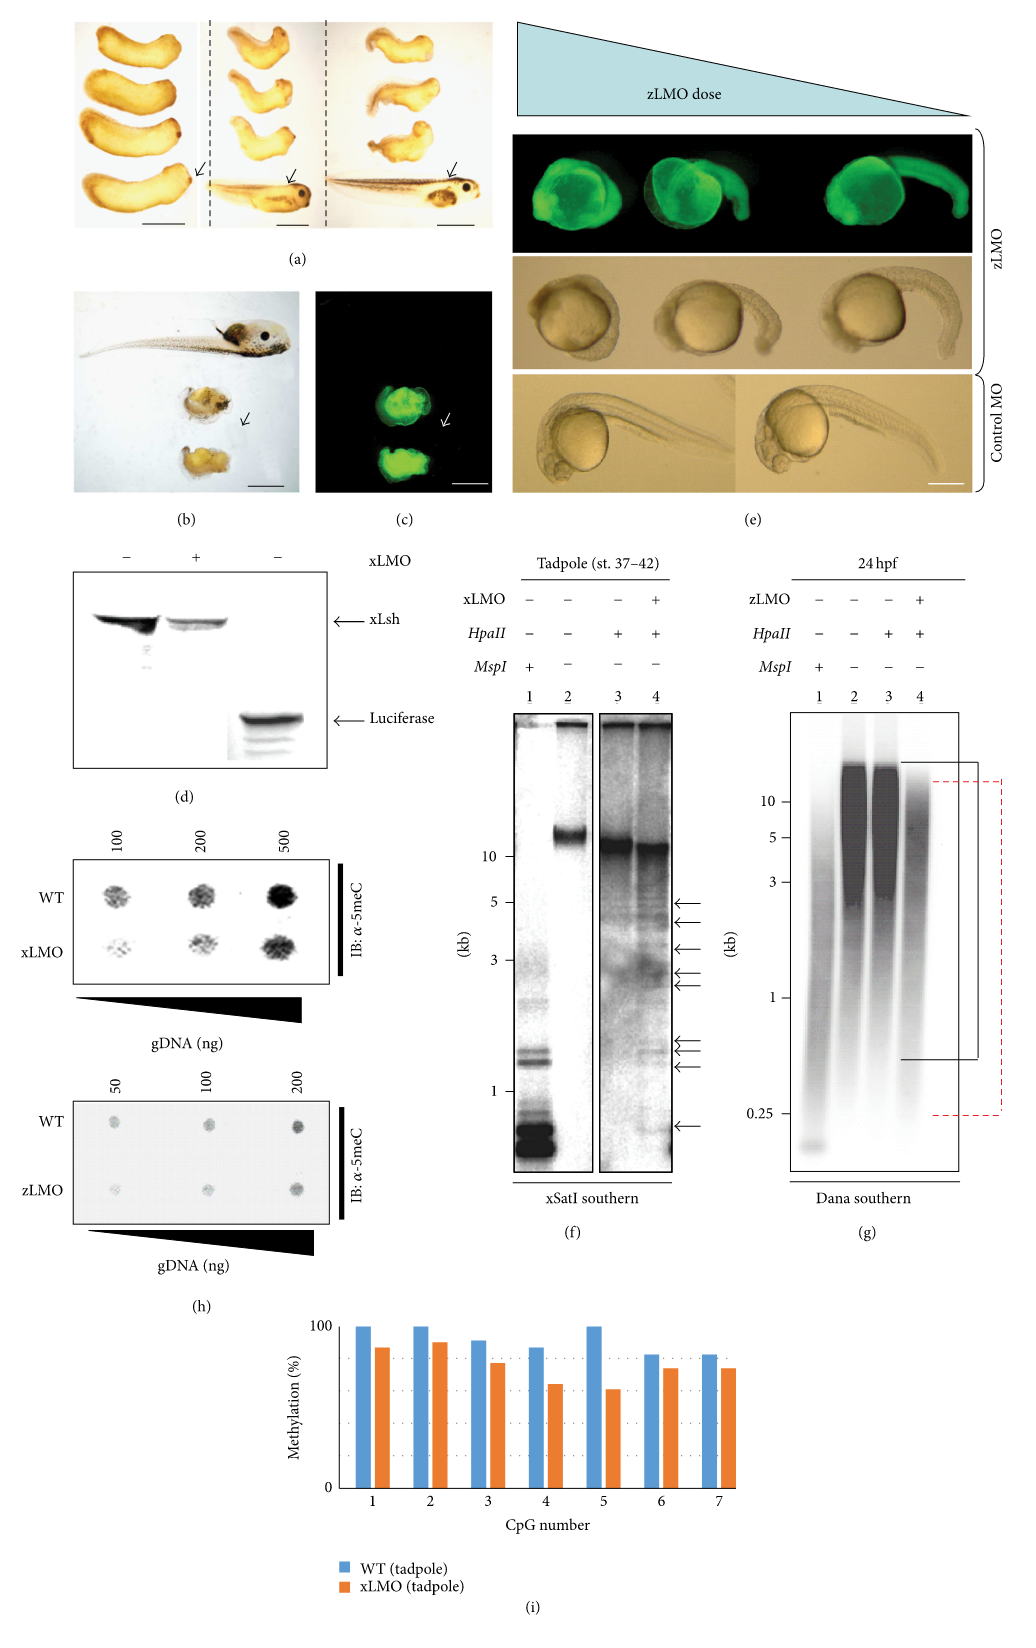
Fig. 1
Lsh is essential for both Xenopus laevis and Danio rerio development. (a–c) Xenopus laevis embryos were injected with xLMO or control morpholinos and allowed to develop. Each panel shows examples of morphant embryos and a control embryo (black arrows). xLMO is fluorescein labelled and successfully injected embryos can be visualised under UV light (c). Developmental stages are (a) 28, 37-38, 42, (b) 42–45, (c) 42–45. Scale bar = 1 mm. (d) In vitro inhibition of xLsh coupled transcription-translation (TNT) with xLMO. 35S-Methionine labelled xLsh protein was prepared by TNT in the presence or absence of xLMO and products separated by PAGE. xLsh production was inhibited by xLMO (compare left and middle lanes). Band on lower right is TNT luciferase protein. (e) Danio rerio embryos were injected with zLMO and allowed to develop to the midsomite stage (24 hpf). Severity of phenotype is dose-dependent (compare panels left to right). UV light showing successful microinjection of three doses of zLMO and severity of phenotype (top panel, lateral view). Brightfield view of three doses of zLMO (middle panel, lateral view). Two representative brightfield control morpholino injected embryos (lower panel, lateral view). Scale bar = 300 μm. (f) Southern blot analysis of genomic DNA isolated from control- and xLMO-injected tadpole embryos using a dispersed repeat xSatI probe. DNA was digested with either HpaII (methylation-sensitive) or MspI (methylation-insensitive HpaII isoschizomer), resolved and probed with radiolabelled xSatI. Digestion with HpaII indicates that xLMO DNA from tadpoles is more frequently cut as indicated by the low molecular weight banding pattern (black arrows) compared to control-injected genomic DNA. (g) Southern blot analysis of genomic DNA isolated from control- and zLMO-injected 24 hpf embryos using a Danio rerio Dana probe. A similar approach was taken as in (f). Compare the extent of HpaII digestion in lane 3 (control) and lane 4 (zLMO). Black bracket = wild type HpaII profile; dashed red bracket = zLMO HpaII profile. DNA sizes are indicated in kilobases to the left of each gel. (h) Upper: dot blot of Xenopus laevis genomic DNA probed with 5-methylcytosine antibody. Note the weaker binding of antibody to the xLMO DNA indicating global hypomethylation; lower: dot blot of Danio rerio genomic DNA probed with 5-methylcytosine antibody. Note the reduced binding of antibody to the zLMO DNA indicating global hypomethylation. (i) Summary of bisulfite sequencing of xSat in wild type and xLMO tadpole embryos. Vertical axis: % methylation; horizontal axis: each CpG in xSat amplicon.

