
|
Fig. S4
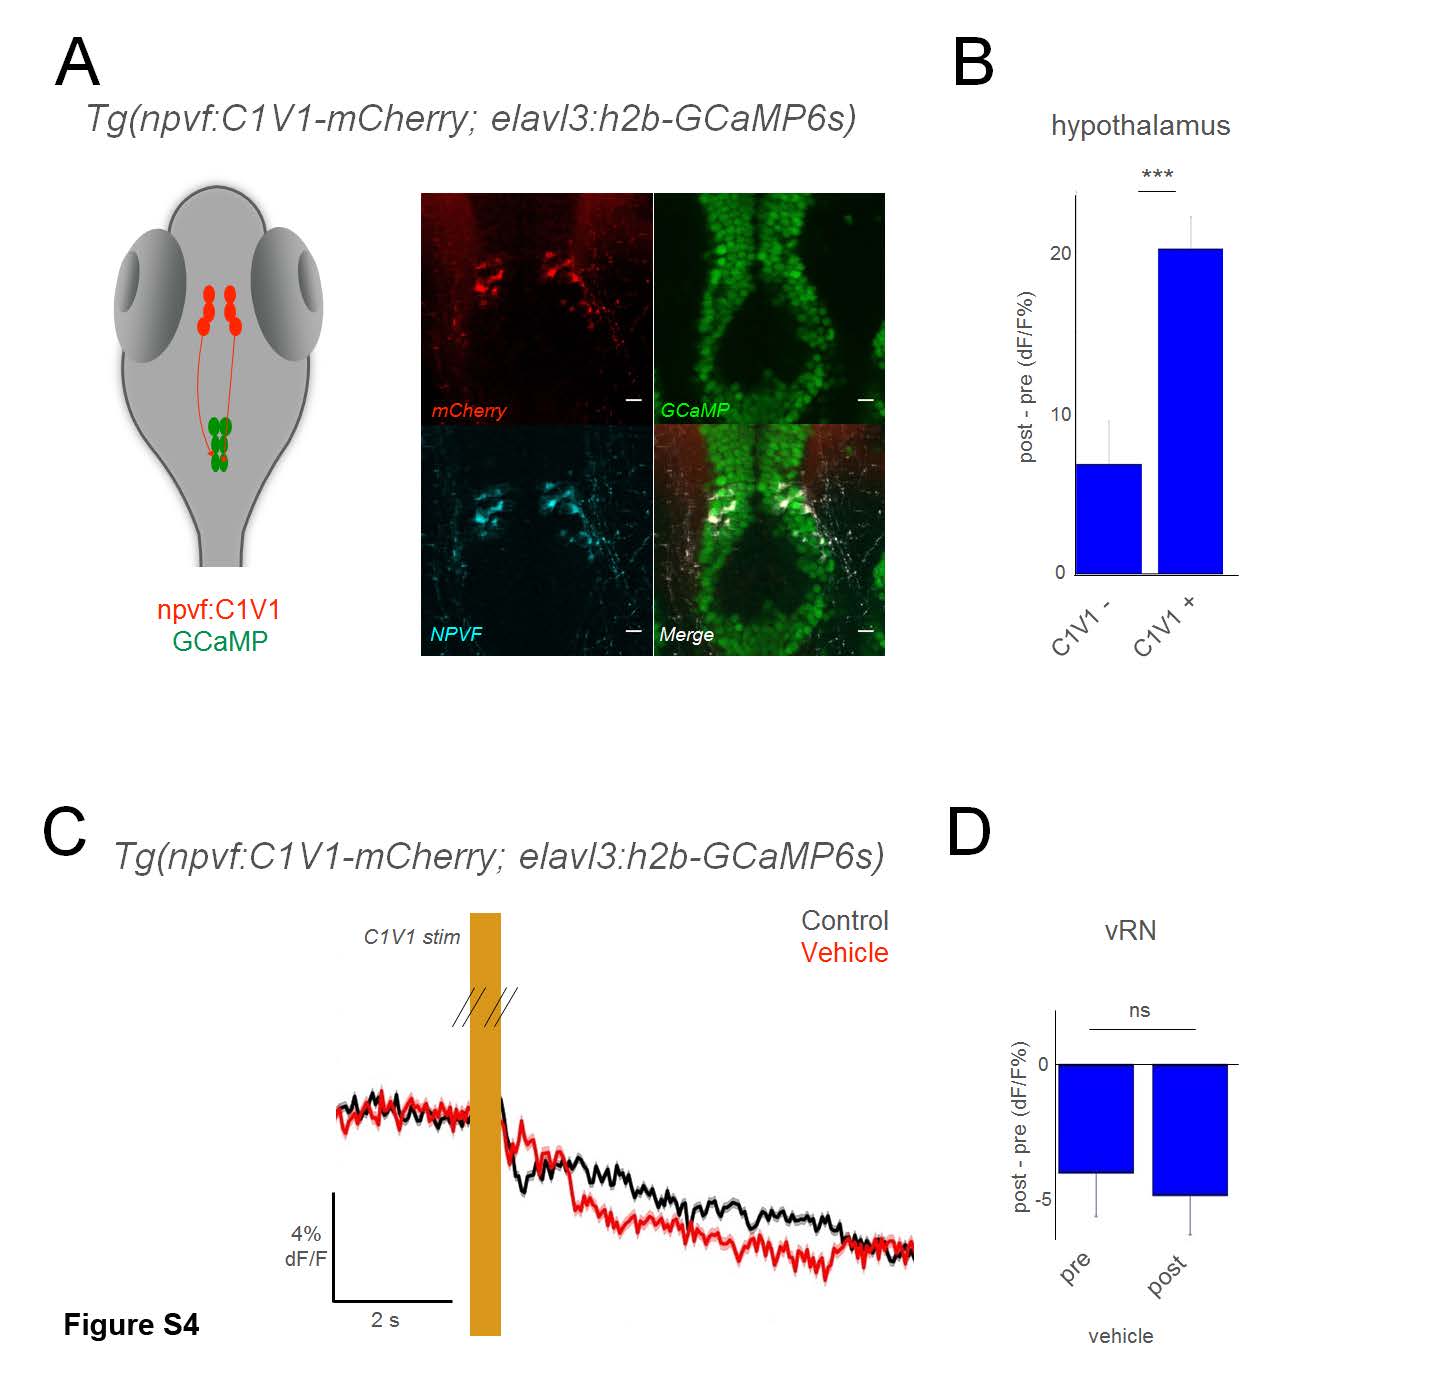
Optogenetic activation of NPVF neurons using C1V1.
A) Schematic of optogenetic experiments, and overlay of mCherry and NPVF antibody stains on GCaMP+ hypothalamus neurons in Tg(elavl3:h2b-GCaMP6s) larvae. B) Grouped data from C1V1- (3 larvae), and C1V1+ (10 larvae). C) Schematic of optogenetic experiments, and mean response of vRN neurons to optogenetic activation of NPVF+ neurons, before and after application of vehicle (swapped out fish water). Responses are the mean of all neurons in one example larva. D) Grouped data from C1V1+ fish before and after vehicle application (5 larvae for each condition). Comparison is a 2-tailed t-test. *** p<0.001; ns: not significant (p>0.05) Scale bars: 10 μm