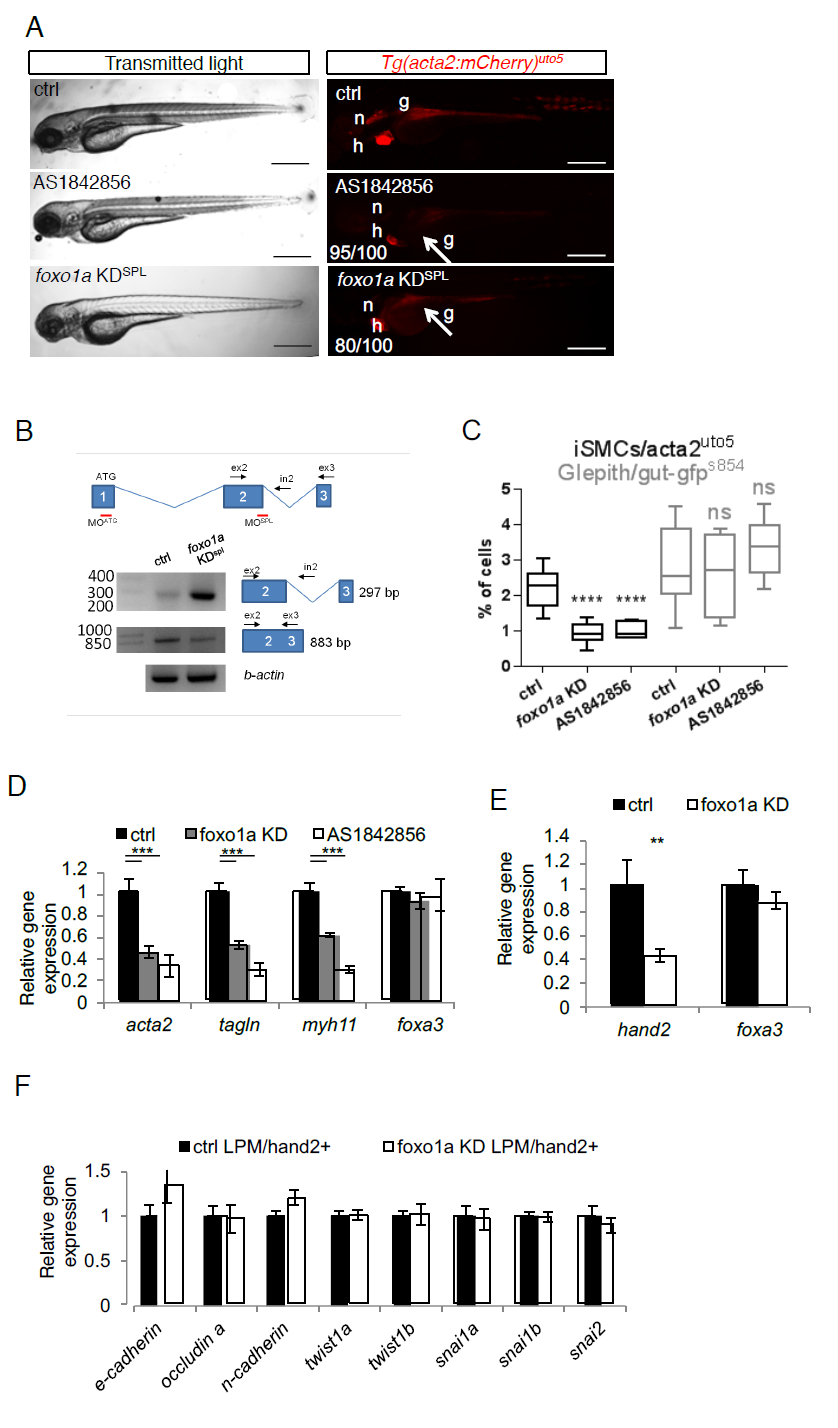
Fig. S5
foxo1a KD impairs iSMC differentiation in zebrafish embryos. a) Pharmacological and genetic inactivation of foxo1a impairs iSMC development. Bright-field and fluorescent images of Tg(acta2:mCherry)uto5 embryos treated with the Foxo1 inhibitor AS1842856 or injected with a foxo1a morpholino (KDspl). While pharmacological or genetic foxo1a inhibition in zebrafish did not alter embryonic development, Foxo1a-deficient embryos displayed impaired iSMC development (arrow), as shown in the embryos injected with Tg(acta2:mCherry)uto5. The number of embryos exhibiting the phenotype is indicated. Scale bar, 200 μm. Notochord: n; heart: h; gut: g. b) Schematic diagram of the three foxo1a exons (not to scale) showing the locations of binding sites of two different foxo1a morpholinos, one targeting the initiation codon (KDATG) and the other targeting the spice donor site for intron 2 (KDspl). Black arrows indicate the primer used. As shown in the RT-PCR experiments, foxo1a KDspl-injected embryos exhibited reduced foxo1a wild-type mRNA expression and increased levels of the intron 2-containing form. c) Pharmacological and genetic inactivation of foxo1a impairs iSMC cell number. Box and whisker plots showing the percentage of iSMCs or endodermal cells isolated by fluorescence-activated cell sorting (FACS) experiments from the trunk of double Tg(acta2:mCherry)uto5 (Xia.Eef1a1:GFP)s854 embryos at 72 hpf after chemical (AS1842856) or genetic (foxo1a KD) foxo1a blockage. foxo1a KD impaired iSMC development but did not affect endoderm differentiation. The boxplots show the maximum, minimum, upper and lower quartiles, and the sample median. Stars represent the results of one way-ANOVA-Dunnett's Post Hoc test (*p<0.05, **p<0.01, ***p<0.001). (Left to right) n = 10, n = 6, n = 6, n = 10, n = 4, and n = 6 groups of 10-20 embryos. d) Pharmacological and genetic inactivation of foxo1a impairs iSMC marker expression. mRNA levels of acta2, tagln, myh11, and foxa3 were measured in 72 hpf embryos by qRT-PCR after foxo1a blockade. iSMC markers were significantly downregulated, whereas the endodermal marker foxa3 was expressed normally. Stars represent the results of one way-ANOVA-Dunnett's Post Hoc test (*p<0.05, **p<0.01, ***p<0.001) e) Genetic inactivation of foxo1a affects LPM differentiation. Histograms showing hand2 and foxa3 mRNA levels measured in 48 hpf embryos by qRT-PCR after foxo1a KD. Foxo1a KD impaired the LPM (hand2-positive cells) but did not alter the endoderm (foxa3-positive cells), indicating a specific function for foxo1a in LPM homeostasis. Stars represent the results of unpaired t-tests of mean difference = 0 (*p<0.05, **p<0.01, ***p<0.001) f) foxo1a inactivation does not alter LPM mesenchymalization. Histograms showing qPCR analyses of EMT-related genes in LPM cells sorted from Tg(hand2:EGFP)pd24 after foxo1a KD and controls at 48 hpf. Stars represent the results of unpaired t-tests of mean difference = 0 (*p<0.05, **p<0.01, ***p<0.001).

