
|
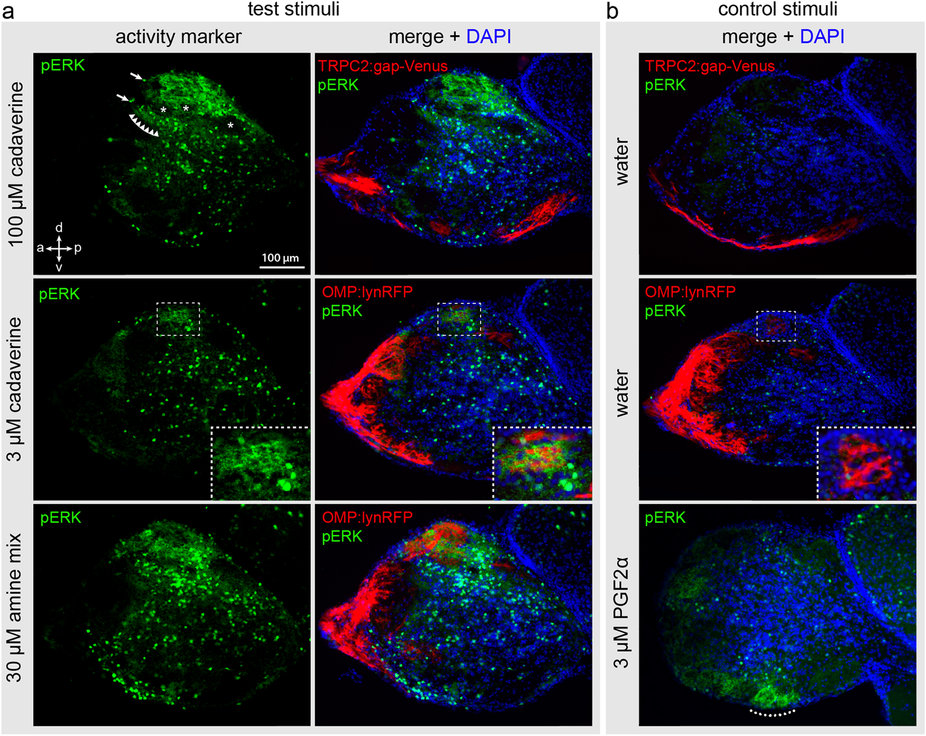
Fig. 4
Adult fish were exposed to odor as shown in Fig. 3 and cryostat sections of the olfactory bulb were processed for immunohistochemical detection of pERK. The sections with maximal pERK signal for the respective odor are shown. (a) Top row, exposure to high level of cadaverine (100 μM); middle row, exposure to low level of cadaverine (3 μM); bottom row, exposure to a mix of 13 different amines (30 μM). Left column of panel (a) shows the pERK signal, right column shows the pERK signal merged with DAPI and the cell type markers TRPC2 and OMP as indicated on the panels. Note a strong signal in dorsal glomeruli for high cadaverine and the amine mix, and a much more restricted dorsal signal for the low cadaverine concentration. (b) Stimulation with water as negative and PGF2α as positive control as indicated. No pERK labelling is visible in the water control in both the TRPC2:gap-Venus and OMP:lynRFP transgenic lines (both shown as red fluorescence for consistency reasons). PGF2α activates a ventral glomerulus (dotted line), as described in ref. 18. Arrows indicate exemplary pERK-labelled cell bodies in the OB. Row of triangles shows a weak labelling of the neuropil in the vicinity of the dlG. Asterisks point out pERK-negative glomeruli interspersed with the active glomeruli in the dlG. Dashed boxes in the middle row show enlarged views of the single-cadaverine responsive glomerulus, which is pERK-positive after stimulation with 3 μM cadaverine and pERK-negative in the negative control.