
|
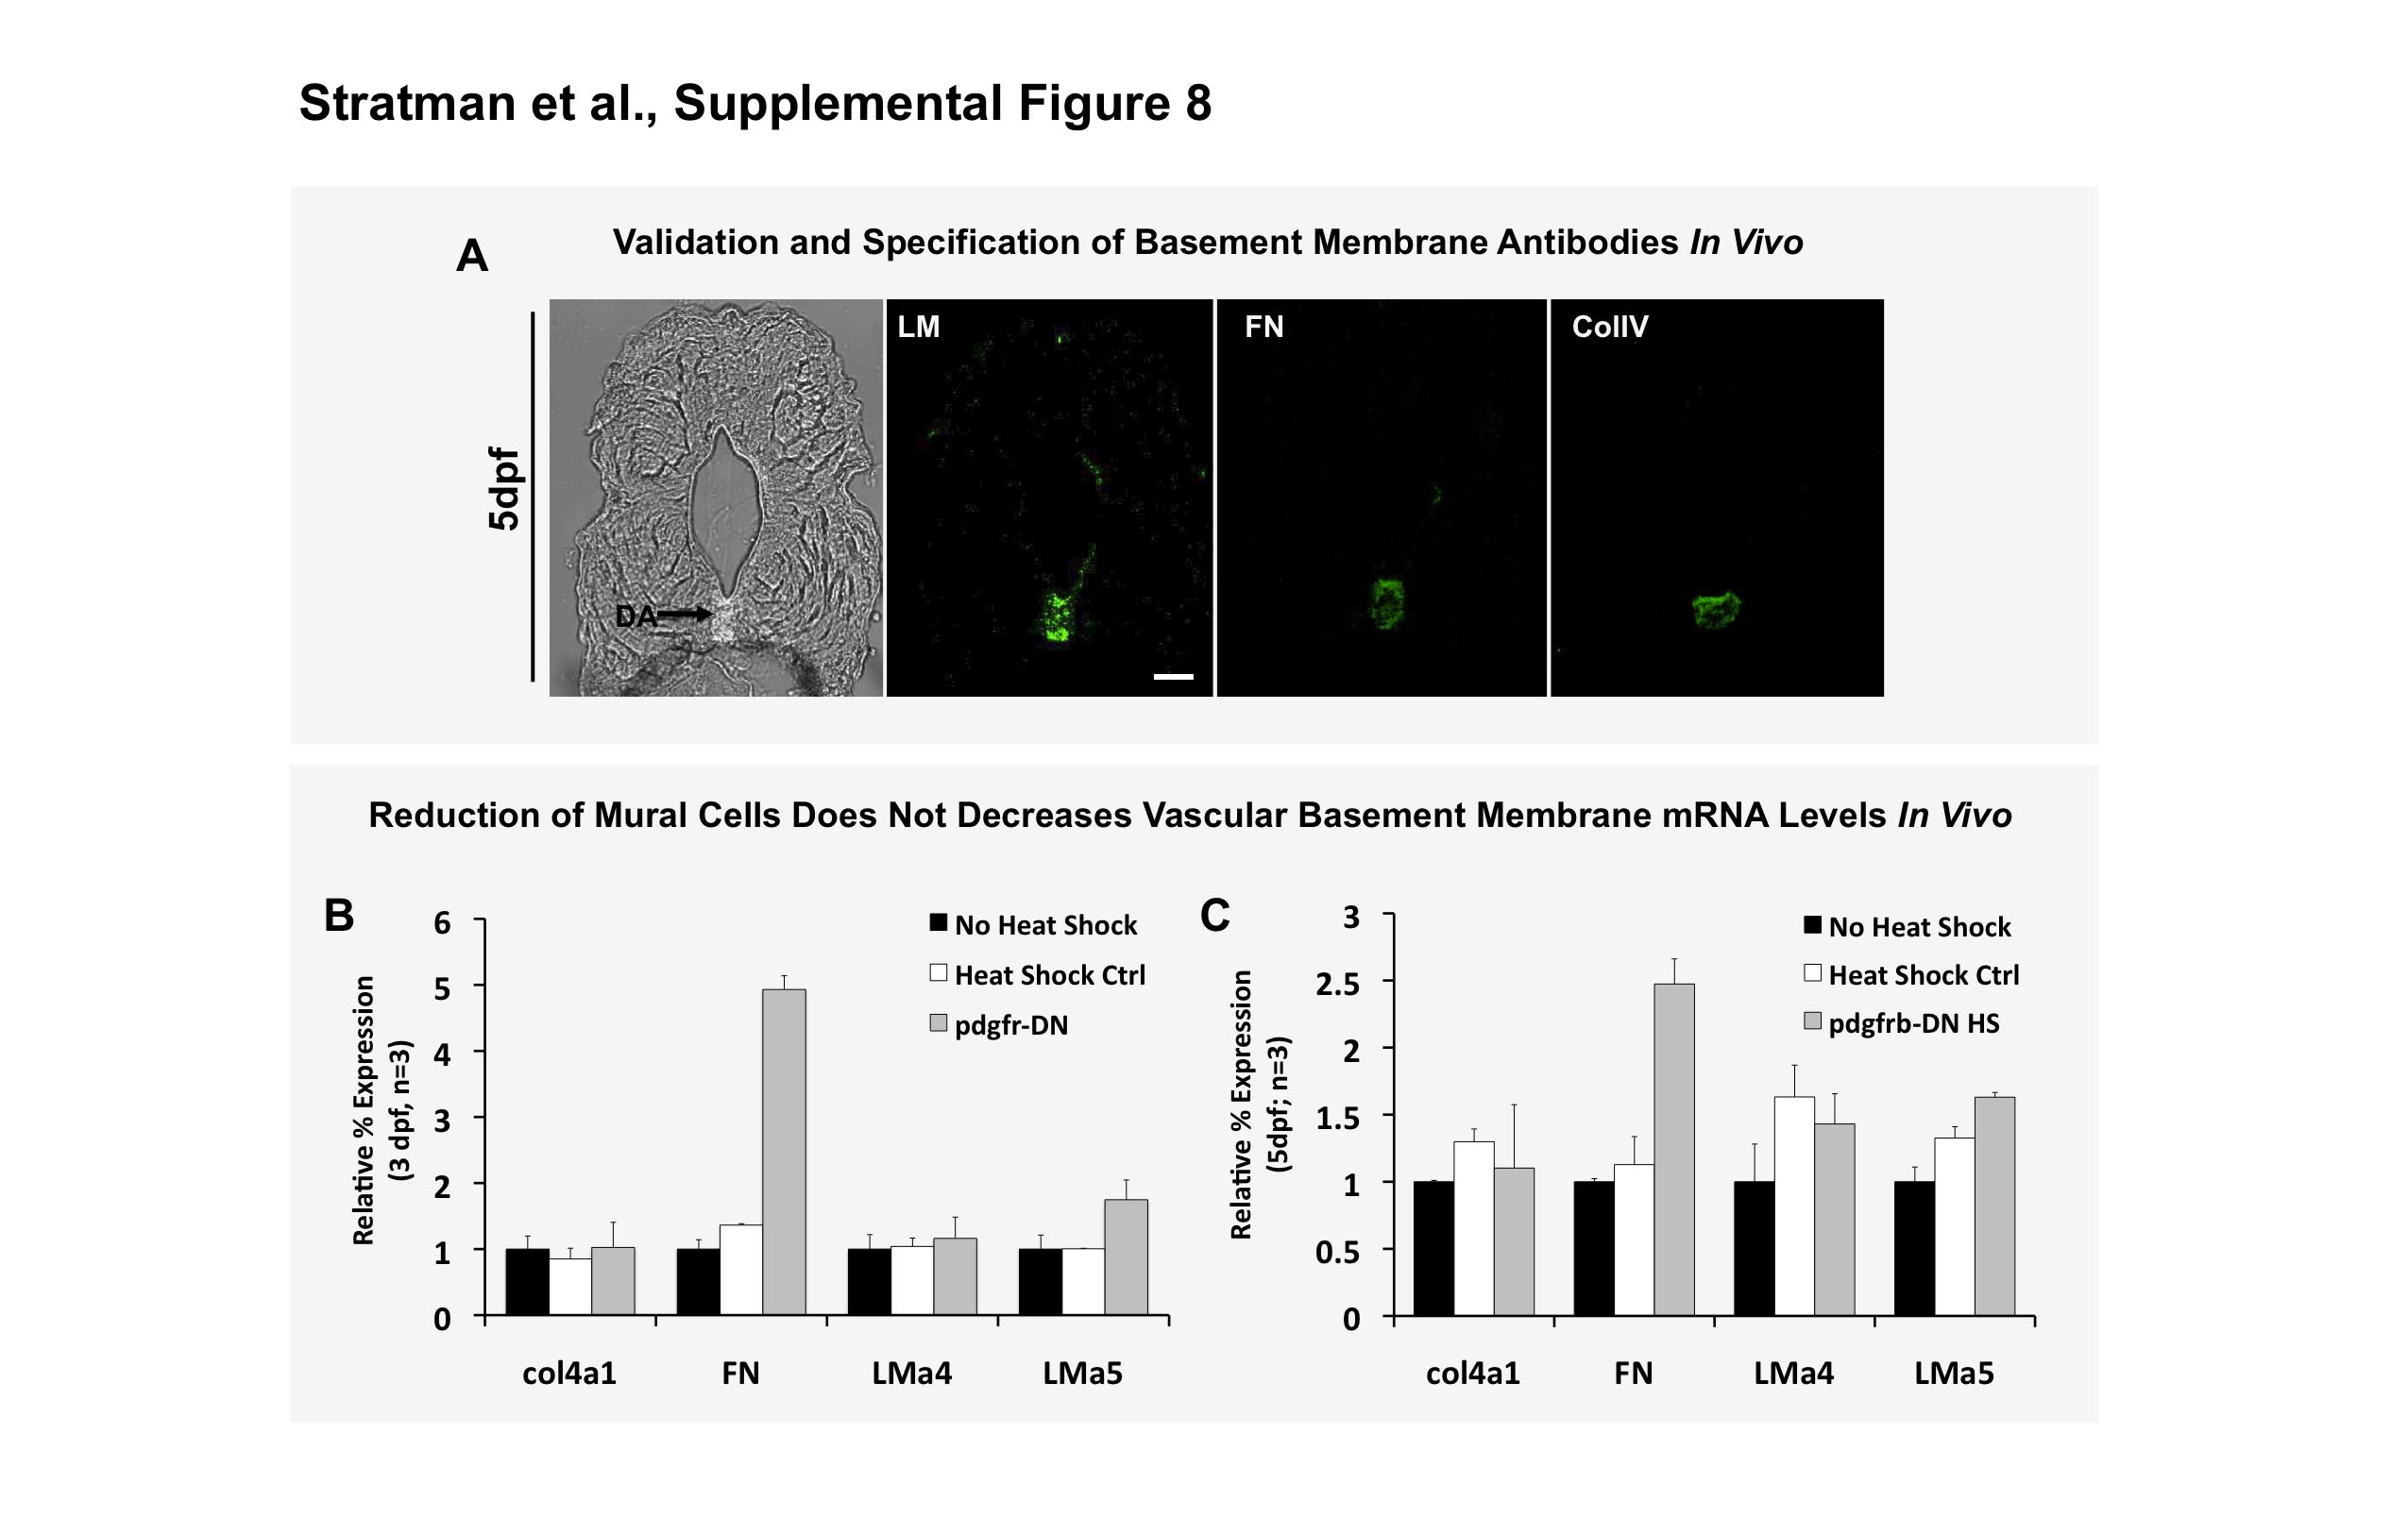
Fig. S8
mRNA transcript levels of individual basement membrane components are not reduced. (A) Validation and demonstration of the antibodies utilized to show vascular enrichment of the basement membrane proteins analyzed throughout the manuscript. (B,C) qPCR analysis of mRNA transcript levels of individual basement membrane components. Fish were heat shocked starting at 1 dpf and collected at 3 dpf (B) and 5 dpf (C) for analysis. Data are normalized to ef1α and to no- heat shock controls (black columns). Data represents RNA collected from 15 pooled embryos. qPCR repeated in triplicate twice per sample, with 2 experimental replicates showing consistent results. Scale bars = 50 μm. Mean ± s.d.