
|
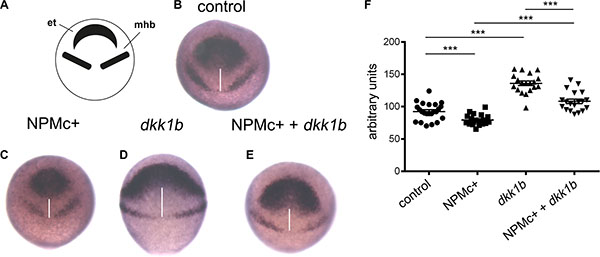
Fig. 2
Analysis of CE movements at gastrulation. Whole mount in situ hybridization for rx3 and pax2a markers of the eye field and telencephalon region (et) and mid-hindbrain boundary (mhb), respectively. All embryos are at 90% epiboly, dorsal view. Distance between rx3 and pax2a expression regions was measured with ImageJ; statistical significance was assessed with a Student’t test. (A) Schematic representation of areas of markers expression. (B) Representative example of uninjected control. Embryos injected with: (C) NPMc+ mRNA; (D) dkk1b mRNA; (E) NPMc+ and dkk1b mRNAs. (F) Graphic representation of the distance between rx3 and pax2a expression regions for each measured sample (20 embryos were analyzed for each condition).