Fig. S1 B
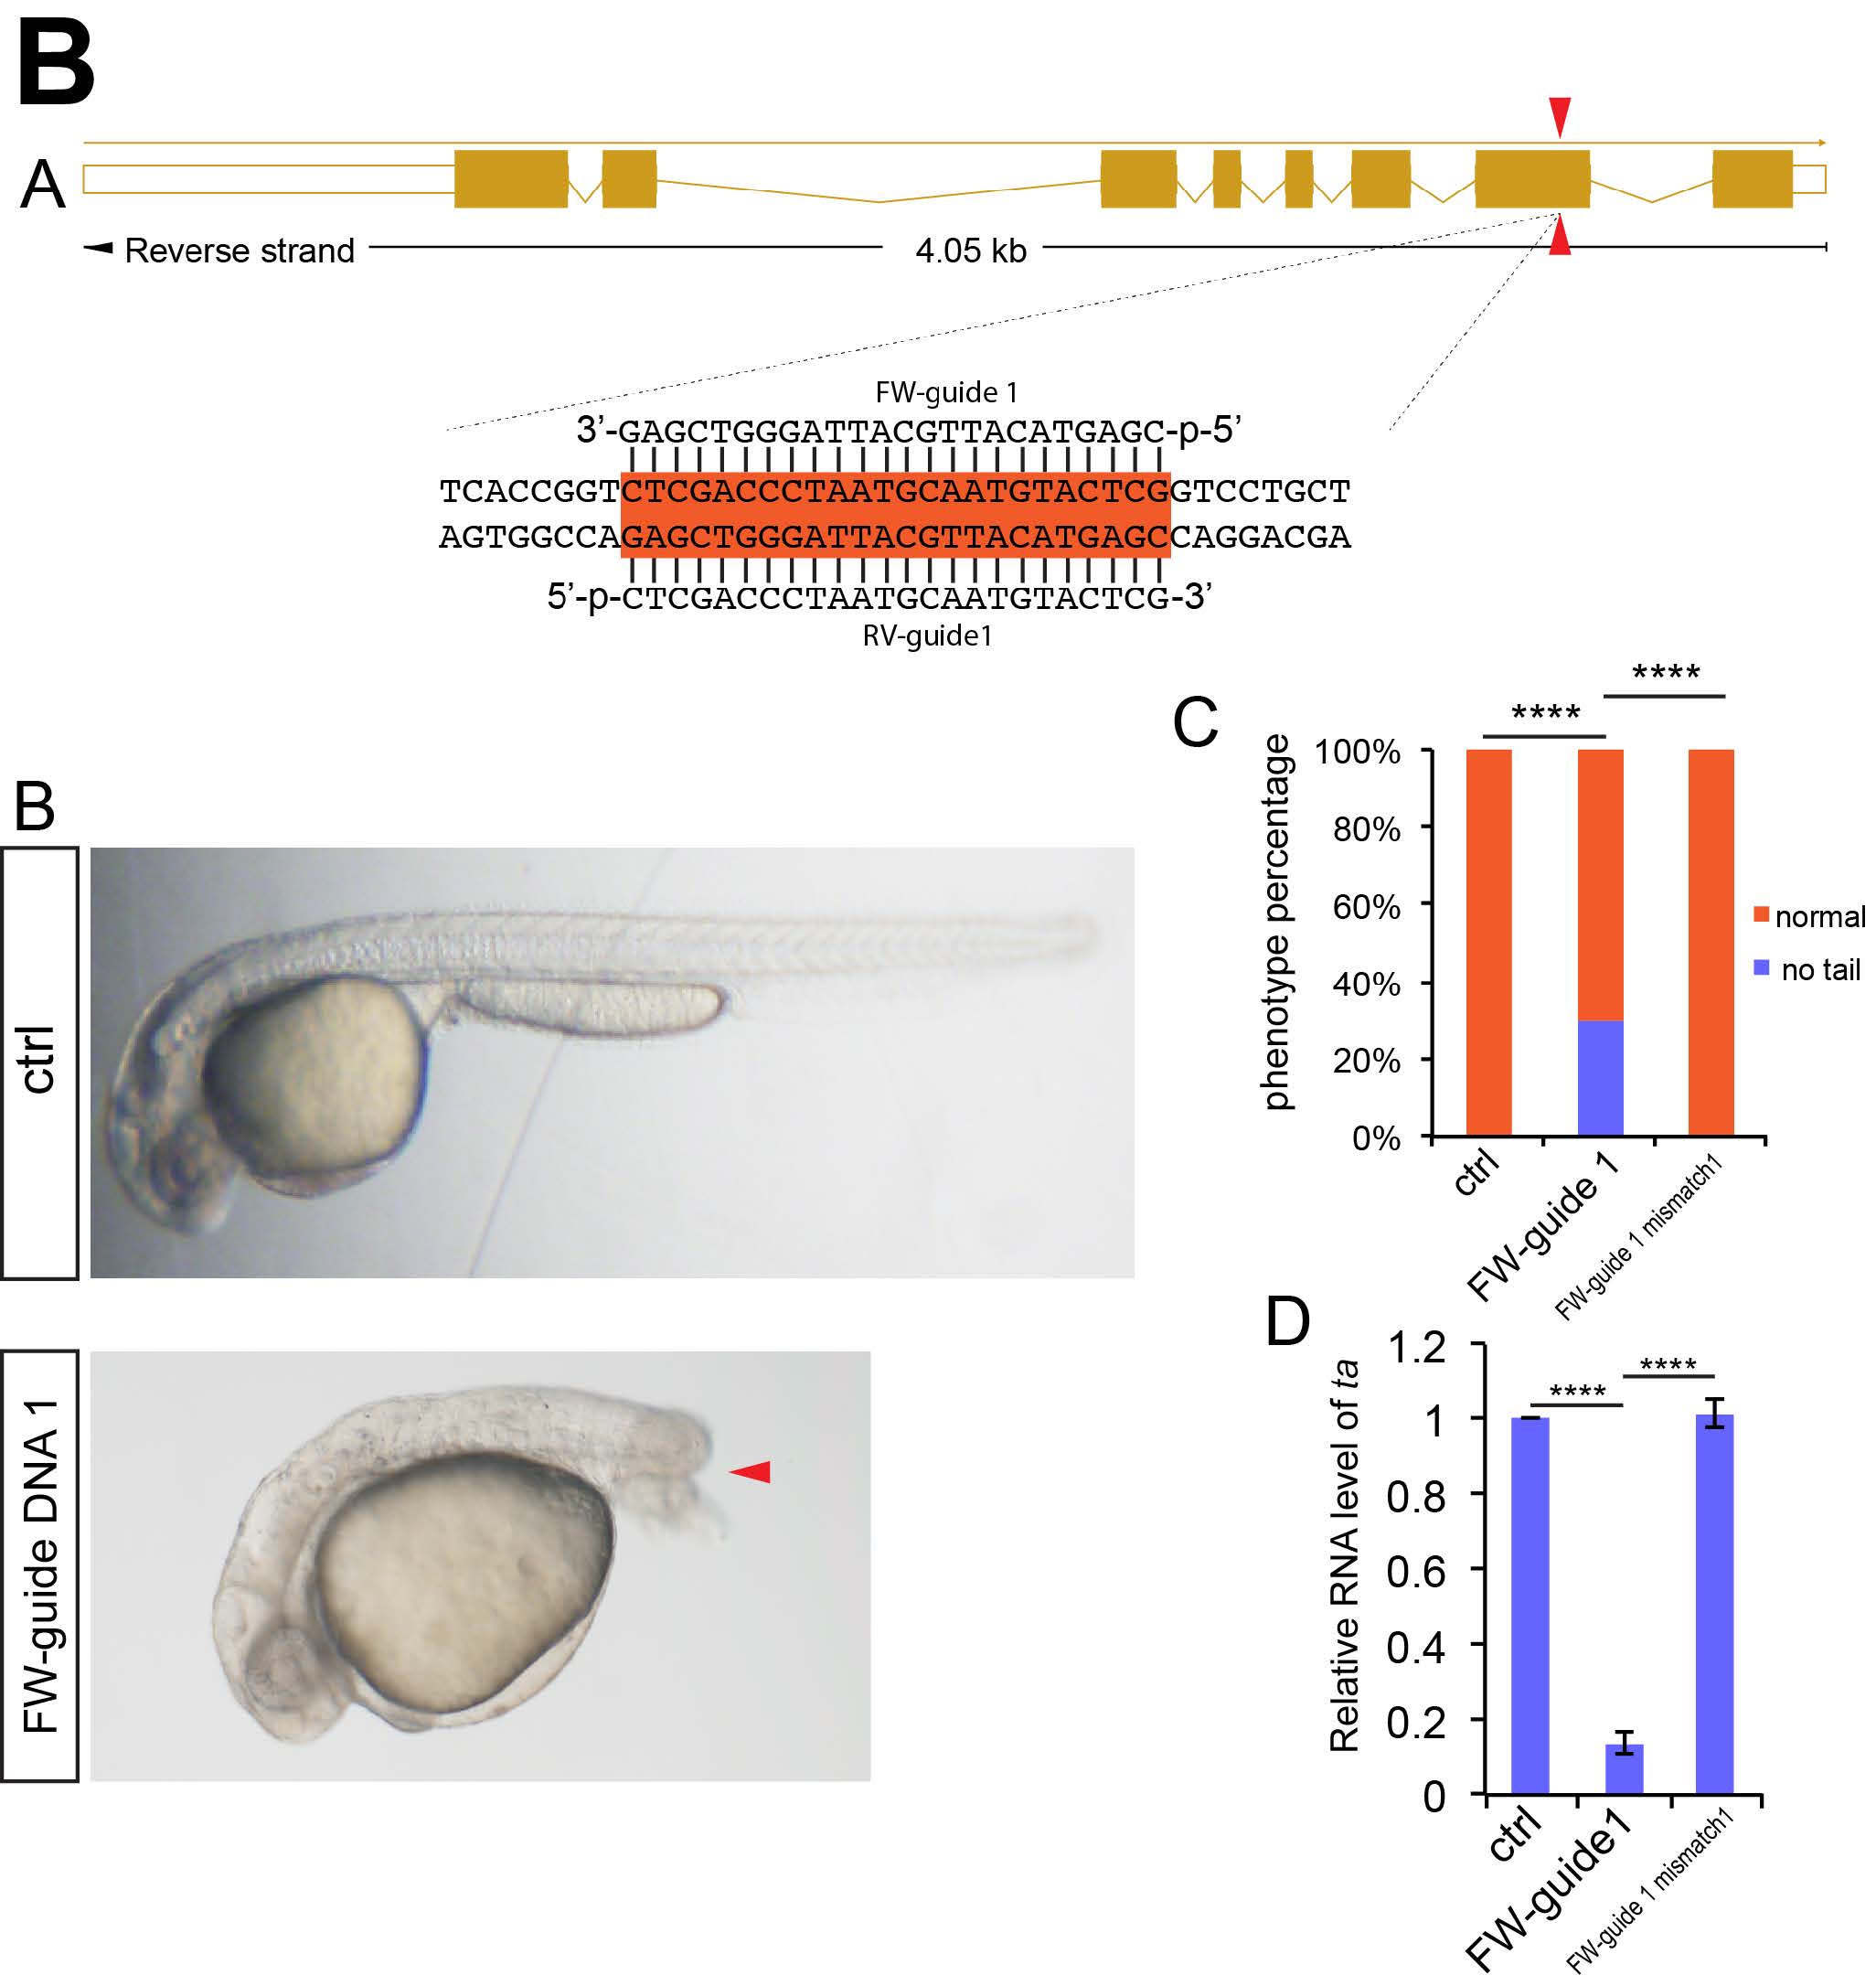
NgAgo based ta gene knockdown caused no tail phenotype in zebrafish. (A) Schematic diagram showing Guide DNA targeting sites on the exon of ta gene. Guide DNA targeting sites are indicated by arrowheads. The targeting sequences are highlighted in orange. (B) Microscopy analysis of tail in control, NgAgo-2nls and ta FW-guide DNA 1 coinjected, and NgAgo-2nls and ta mismatch guide DNA coinjected embryos, lateral view. Red arrowhead indicates disrupted tail. (C) Statistical analysis of phenotype efficiency in control, NgAgo-2nls and ta FW-guide DNA 1 coinjected, and NgAgo-2nls and ta mismatch guide DNA coinjected embryos. χ² test; ****, P<0.0001. (D) Relative mRNA levels of zebrafish ta in 30 hpf control and ta FW-guide DNA 1 and NgAgo-2nls mRNA coinjected embryos. T-test; ****, P<0.0001.

