
|
Fig. 1
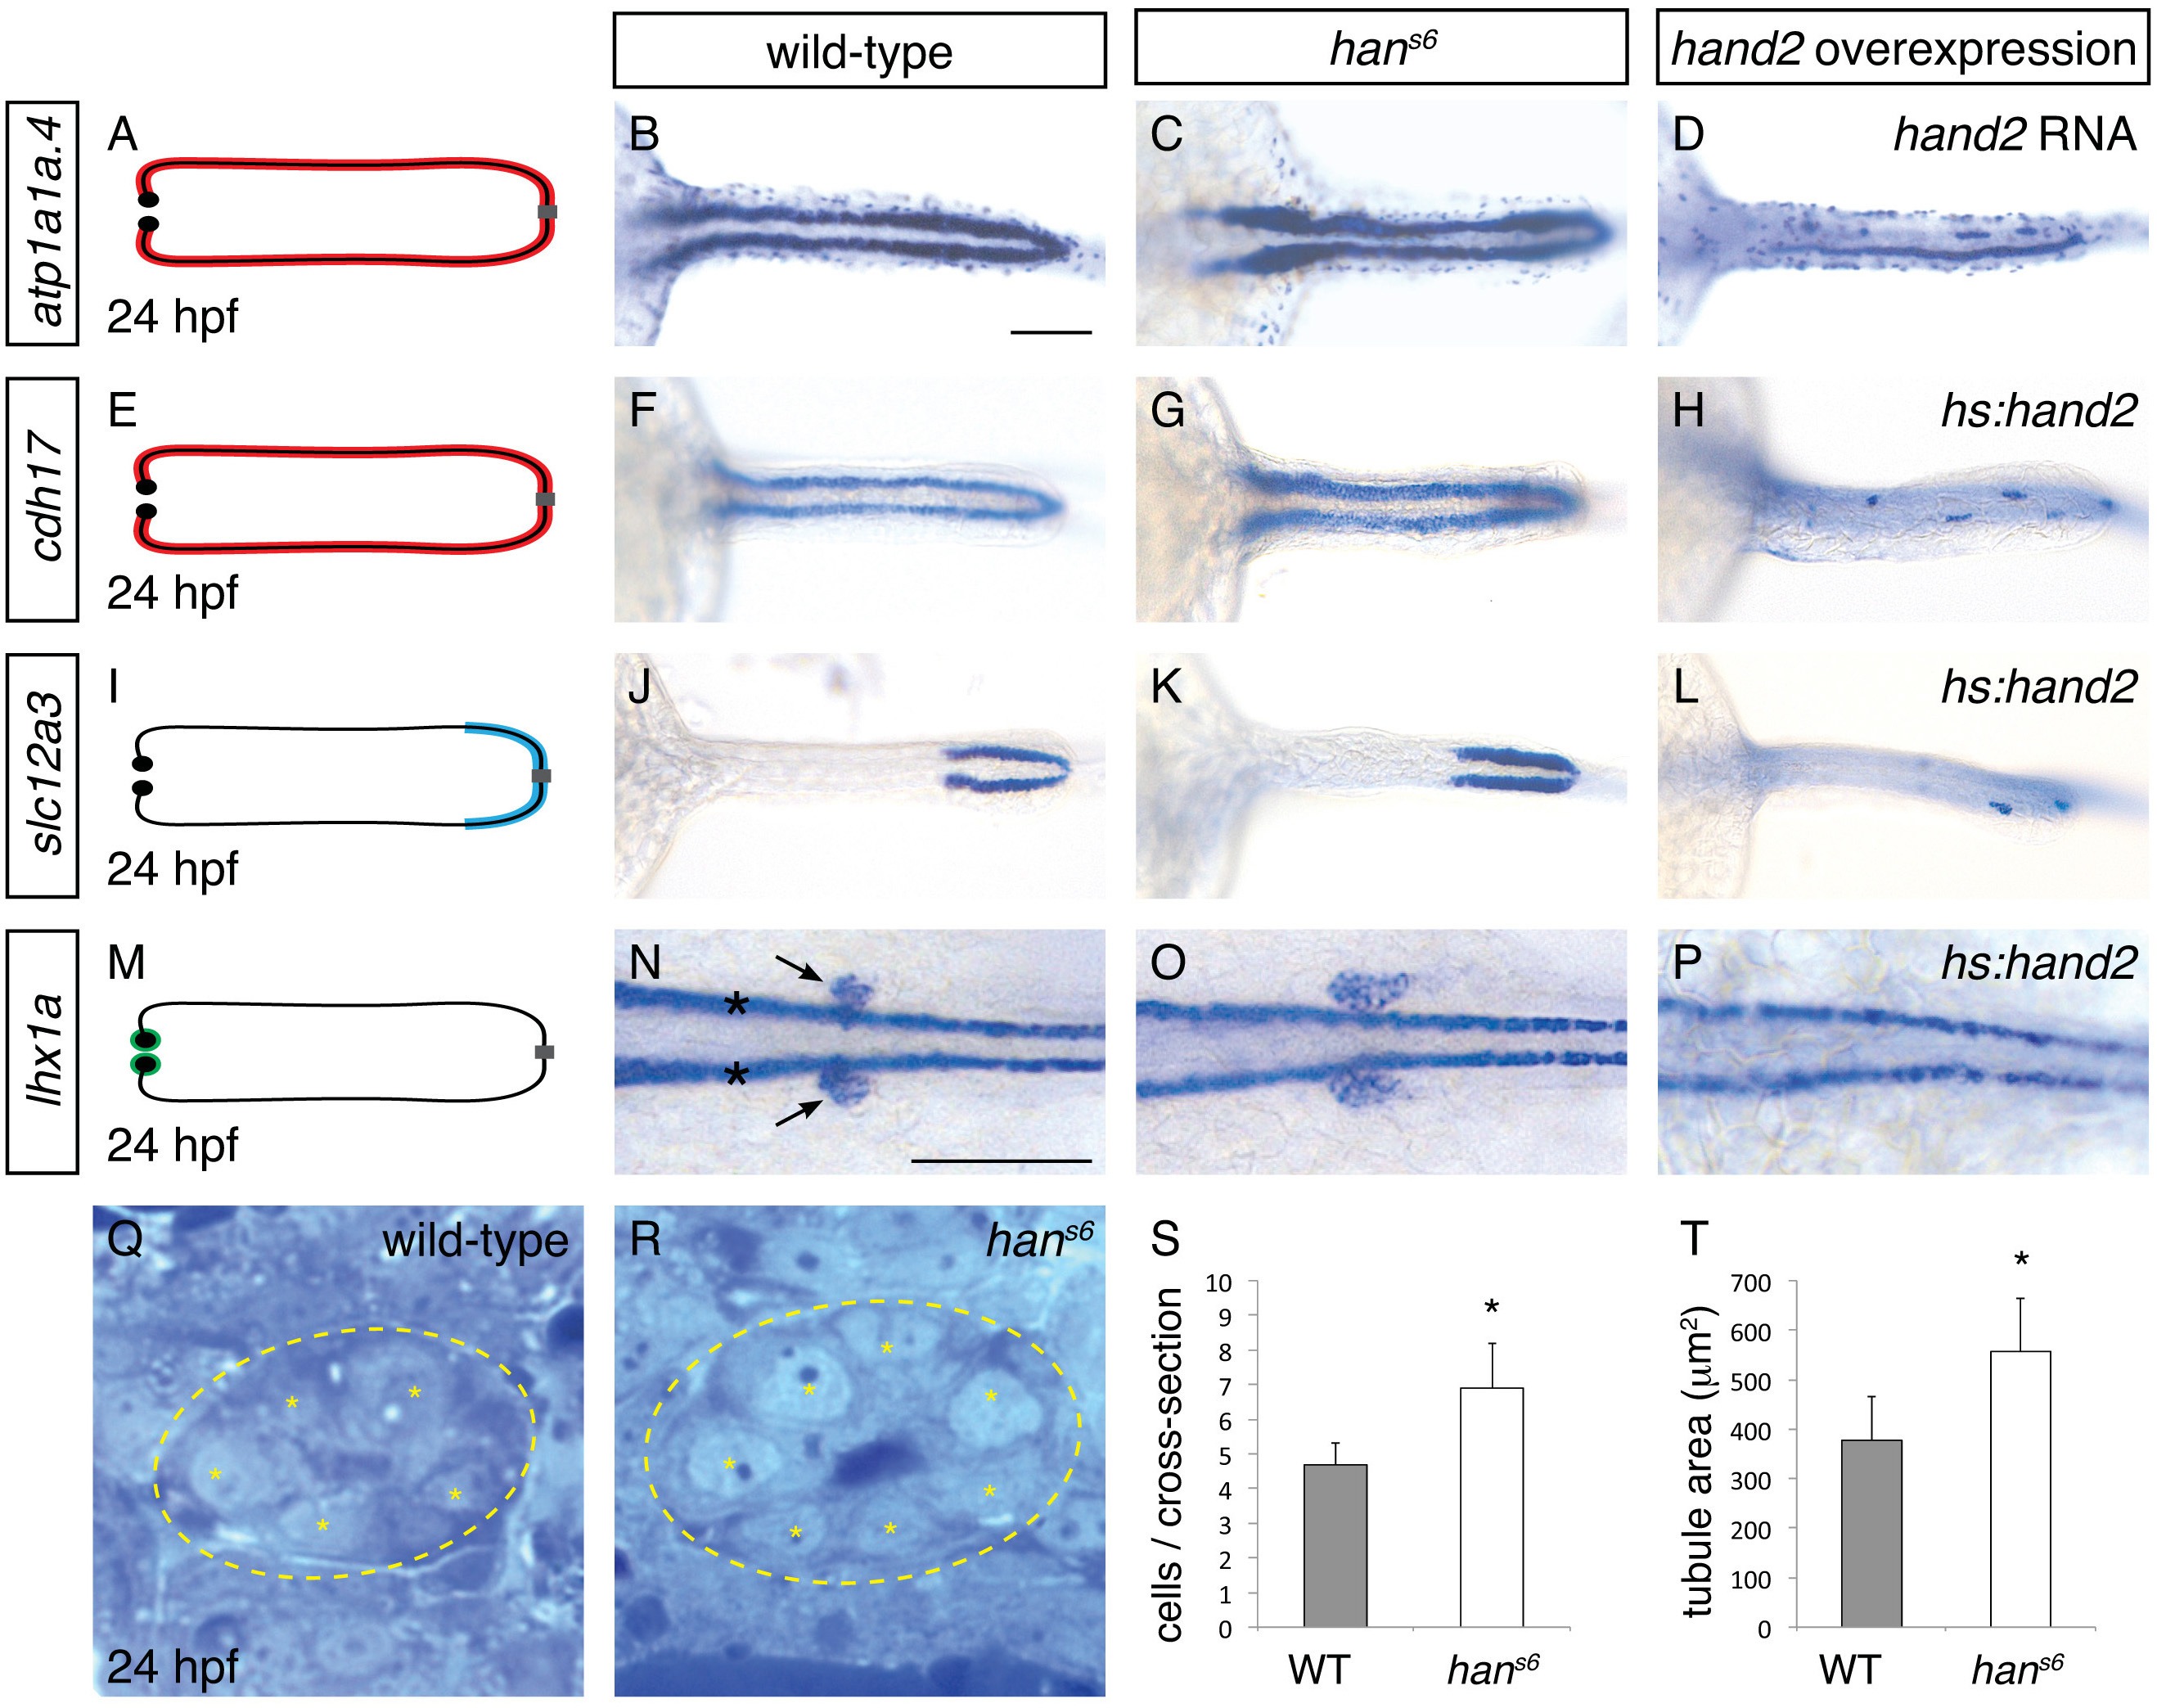
hand2 inhibits pronephron formation.
(A–P) Dorsal views, anterior to the left, of pronephron schematics (A, E, I, M), wild-type embryos (B, F, J, N), hans6 mutant embryos (C, G, K, O), and hand2-overexpressing embryos (D, injected with hand2 mRNA; H, L, P, carrying Tg(hsp70-hand2-2A-mcherry), abbreviated hs:hand2) at 24 hpf. In schematics (A, E, I, M), colored regions correspond to area of pronephron gene expression. In situ hybridization demonstrates that atp1a1a.4 (A–D) and cdh17 (E–H) are expressed throughout the pronephron tubules, slc12a3 (I–L) is expressed in the distal late segments of the pronephron tubules, and lhx1a (M–P) is expressed in the glomerular precursors (arrows, N), as well as overlying spinal neurons (asterisks, N). Compared to wild-type (B, F, J, N), gene expression is expanded in hans6 mutants (C, G, K, O) and reduced in hand2-overexpressing embryos (D, H, L, P). Of note, injection of a hand2 translation-blocking morpholino caused effects on pronephron formation similar to those seen in hans6 mutants (data not shown). Scale bars represent 100 μm. (Q, R) Transverse sections through wild-type (Q) and hans6 mutant (R) pronephron tubules at 24 hpf. Dashed lines outline the tubule and asterisks indicate individual tubule cells. (S, T) Bar graphs indicate the average number of tubule cells per cross-section (S) and the average tubule area per cross-section (T) in wild-type and hans6 mutant embryos; error bars indicate standard deviation. Asterisks indicate statistically significant differences compared to wild-type (p<0.0001, Student’s t test; n = 18).