Fig. 5
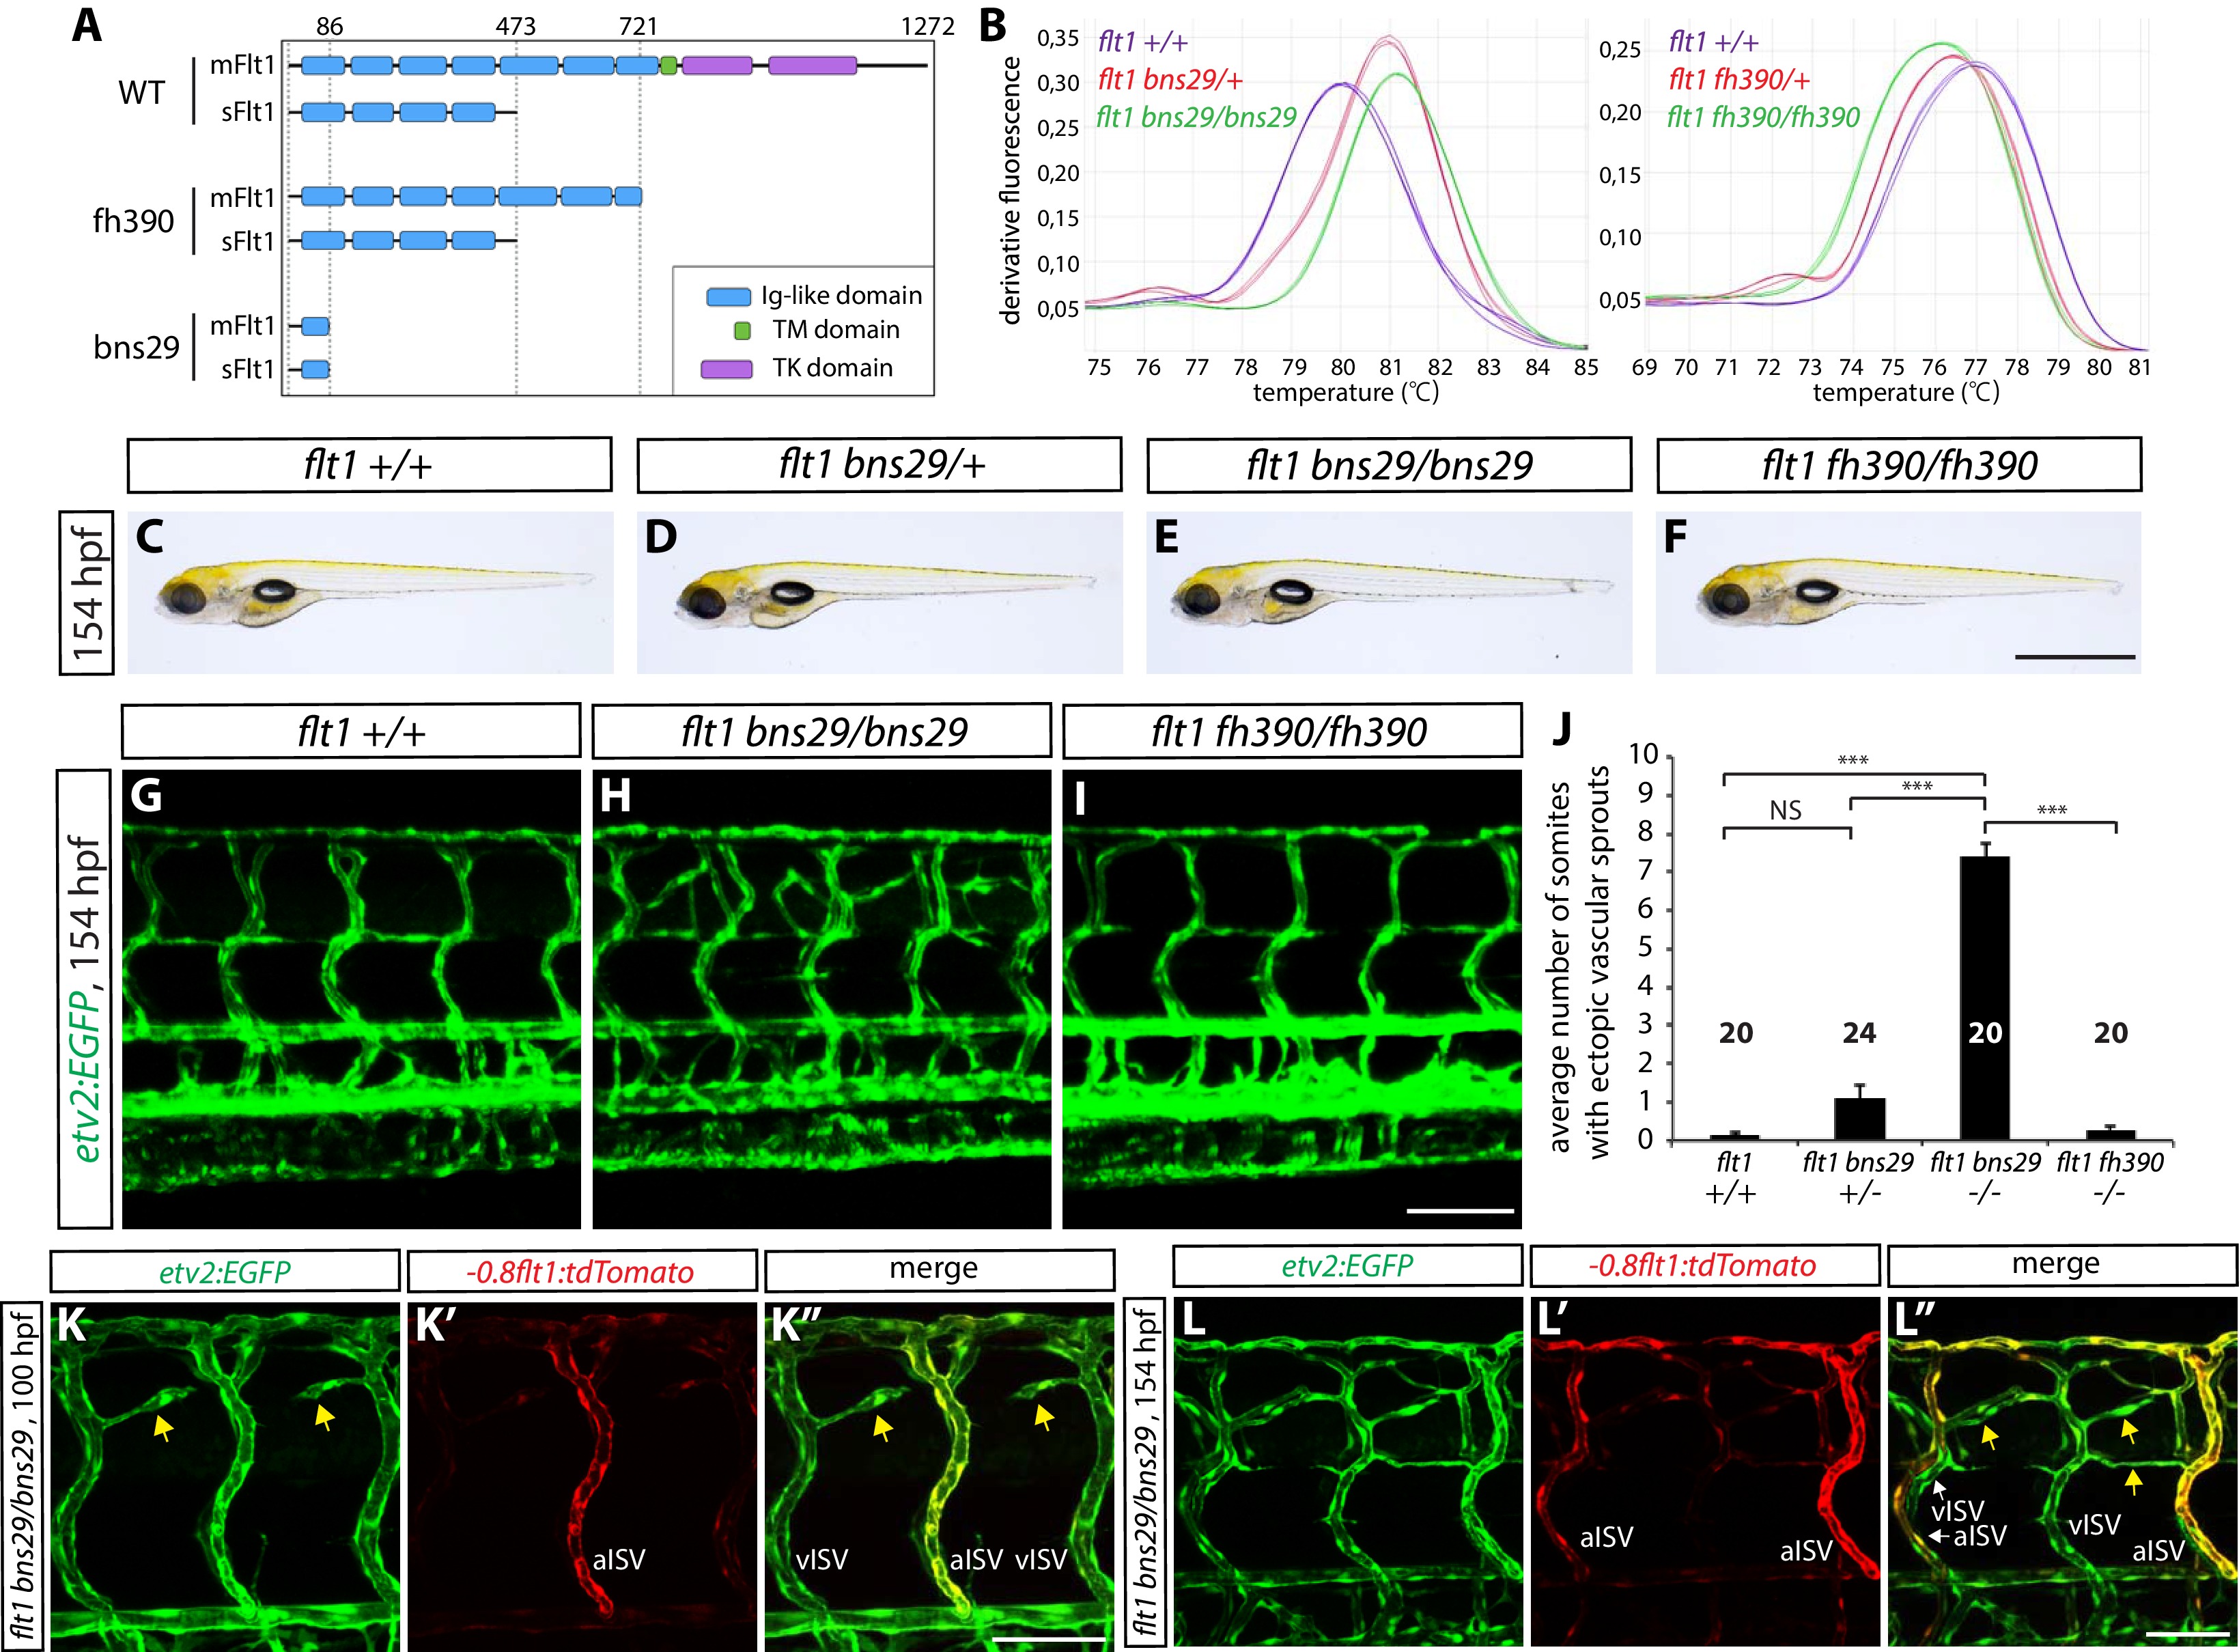
sflt1 mutants exhibit ectopic venous ISV sprouting around the spinal cord.
(A) Predicted domain structures of WT and mutant Flt1 (mFlt1 and sFlt1). (B) High resolution melt analysis used to determine the flt1bns29 (left panel) and flt1fh390 (right panel) genotypes. Melting curves for 3 independent fish of each genotype are shown. (C–F) Representative brightfield images of 154 hpf flt1+/+ (C), flt1bns29/+(D), flt1bns29/bns29 (E), and flt1fh390/fh390 (F) larvae. Scale bar, 1 mm. (G–I) 154 hpf TgBAC(etv2:EGFP) flt1+/+ (G), flt1bns29/bns29 (H), and flt1fh390/fh390 (I) trunk vasculature. Ectopic vessel sprouting is observed in the dorsal trunk of flt1bns29/bns29 (H), but not flt1+/+ (G) or flt1fh390/fh390 (I), fish. Scale bar, 100 µm. (J) Quantification of average number of somites that showed ectopic blood vessels in flt1+/+, flt1bns29/+, flt1bns29/bns29, and flt1fh390/fh390 larvae (10 somites examined per animal; ≥20 animals examined per genotype). (K–K”) 100 hpf TgBAC(etv2:EGFP);Tg(-0.8flt1:tdTomato) flt1bns29/bns29 trunk vasculature visualized by TgBAC(etv2:EGFP) (K) and Tg(-0.8flt1:tdTomato) (K’) expression. Ectopic vessel sprouts in flt1bns29/bns29 fish derive from venous ISVs in most cases (yellow arrows). Scale bar, 50 µm. (L–L”) High magnification images of 154 hpf TgBAC(etv2:EGFP);Tg(-0.8flt1:tdTomato) flt1bns29/bns29 trunk vasculature. Ectopic vessels in the dorsal trunk exhibit weak Tg(-0.8flt1:tdTomato) expression as vISVs do (yellow arrows, L”). Scale bar, 50 µm. In all panels, values represent means ± SEM (*** indicates p<0.001 by one-way ANOVA followed by Tukey’s HSD test).

