Fig. S3
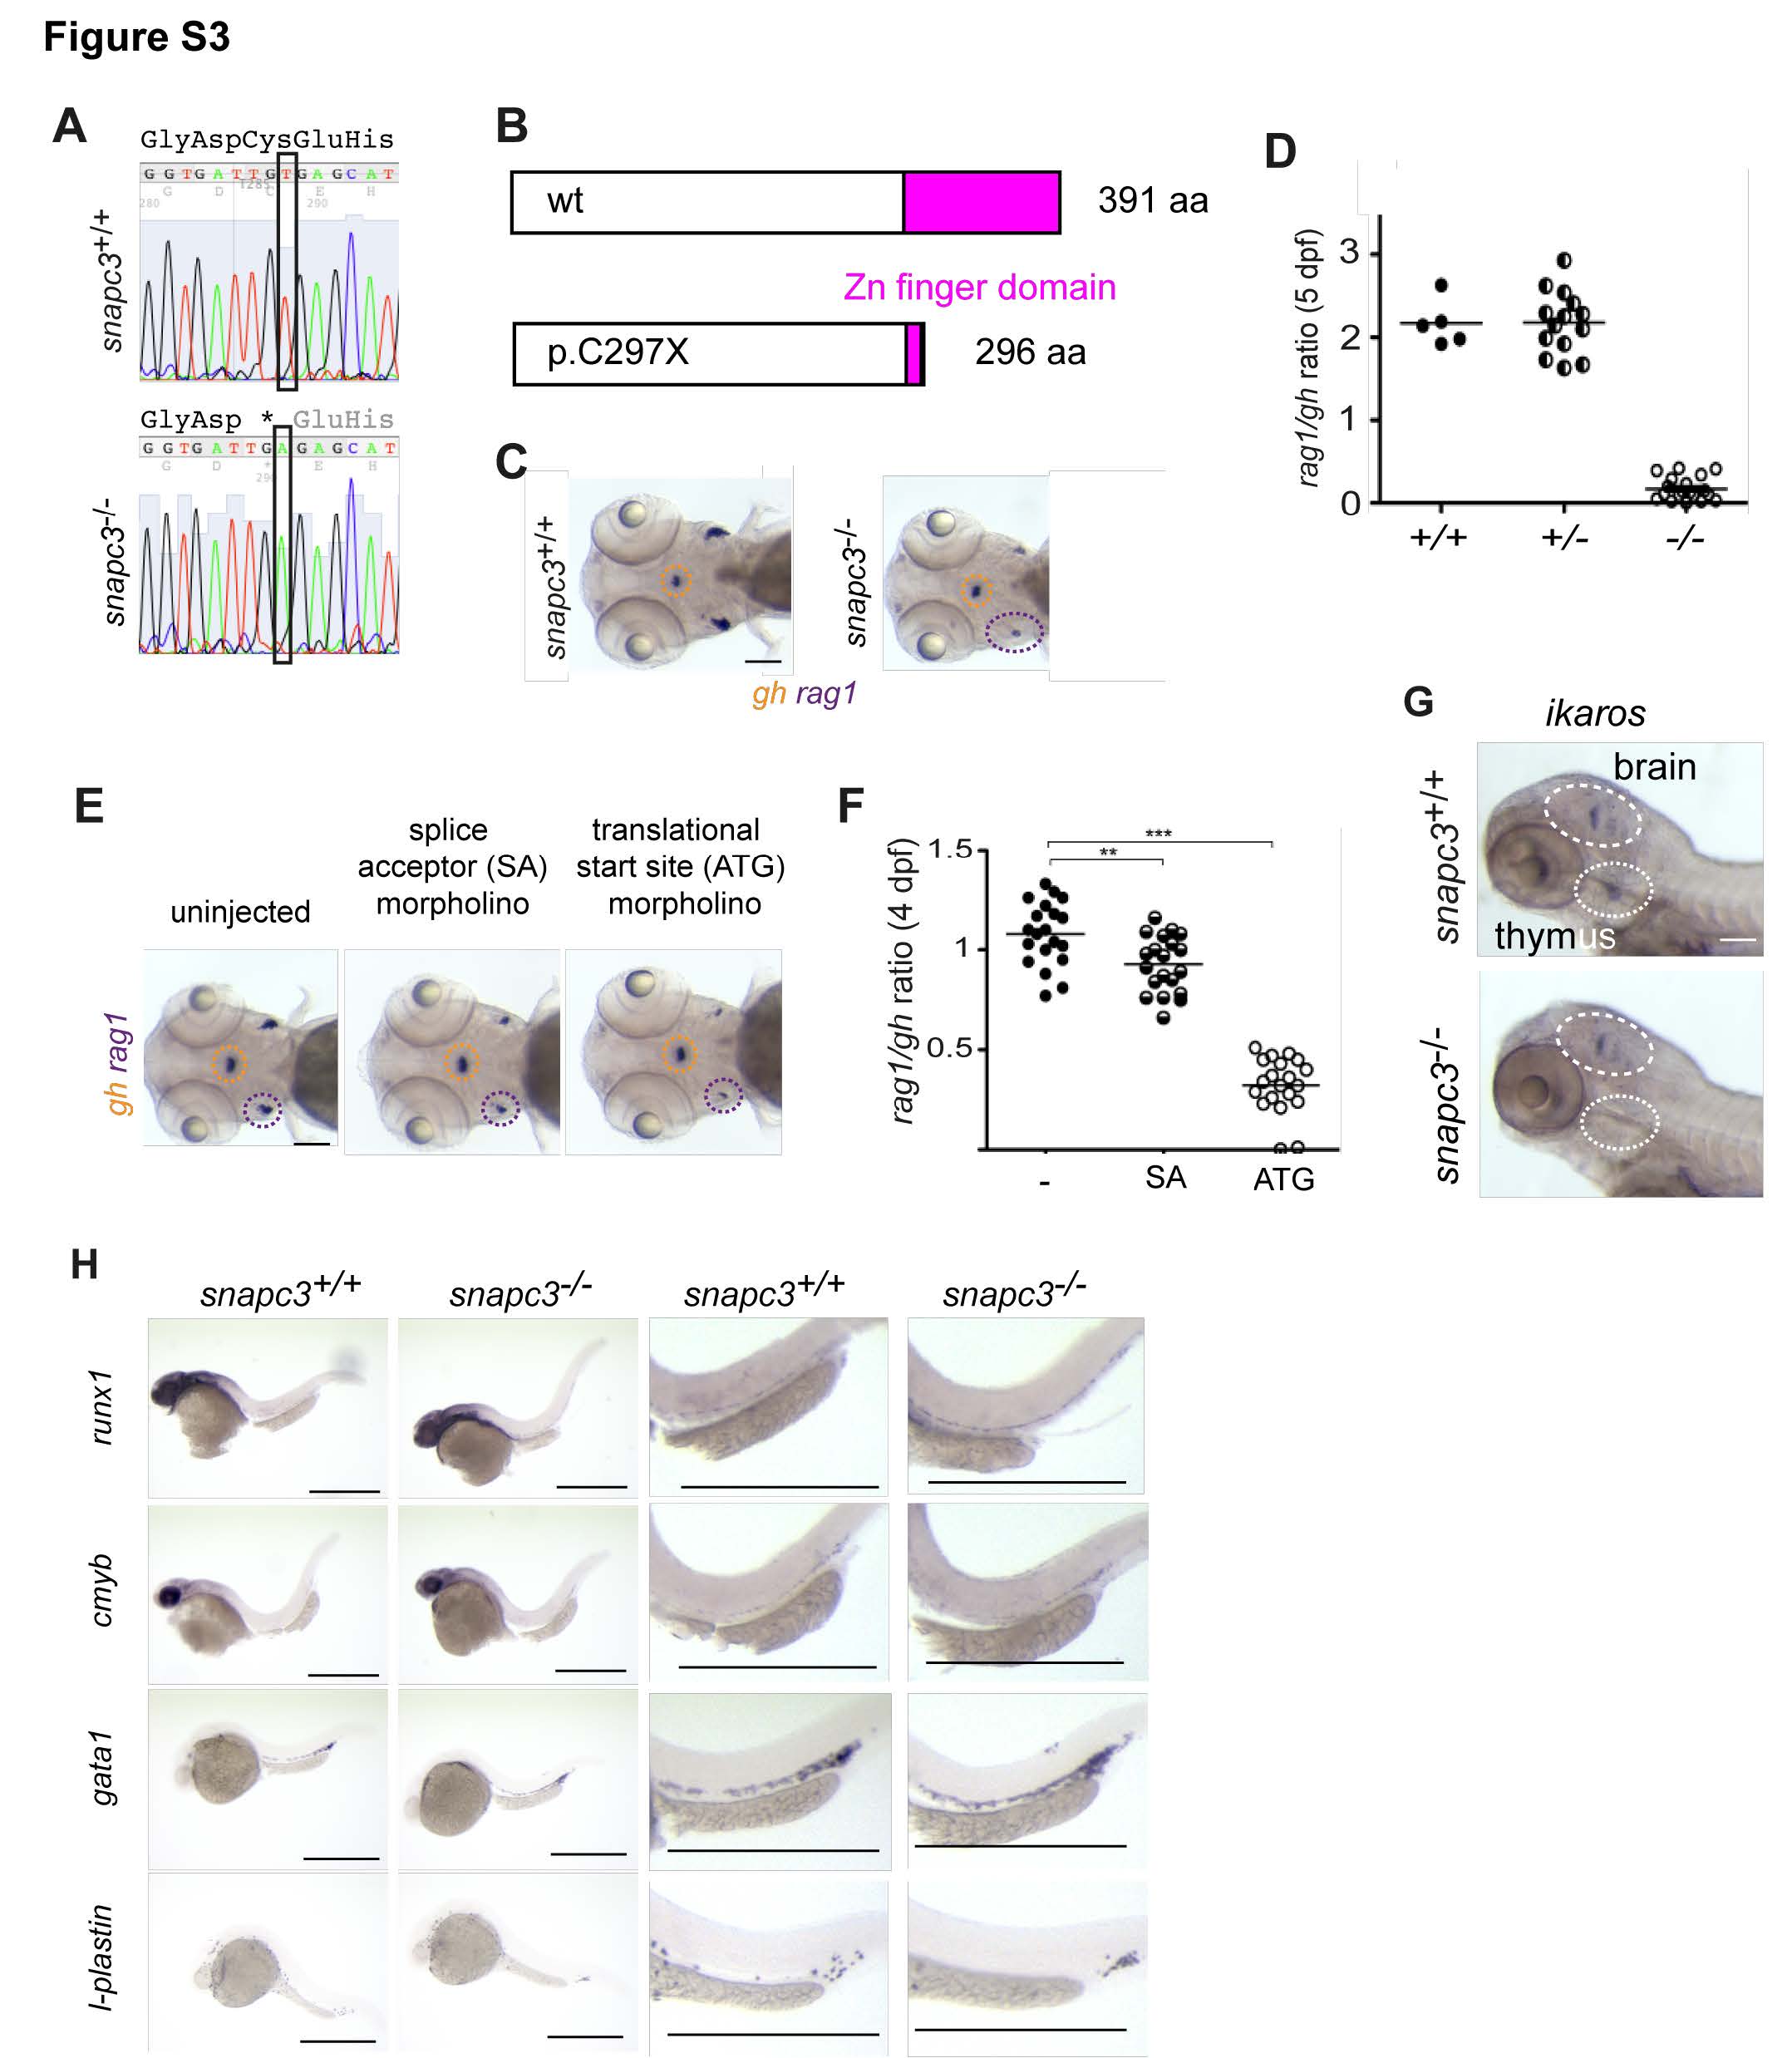
Characterization of snapc3 mutants. Related to Figure 1
(A) Representative sequence traces indicating the G>T transition at nucleotide position 8611002 (Zv9) on chromosome 1; conceptual translation in three-letter code (stop codon is marked by *).
(B) Deduced protein structure of wild-type and predicted mutant (C297X) proteins.
(C) Diagnostic whole-mount RNA in situ hybridization pattern in snapc3 mutants using rag1 and gh at 5 days post fertilization (dpf). Scale bars, 10 μm.
(D) Quantification of thymopoietic activity in snapc3 mutants expressed as a ratio of rag1 to gh signals derived from analyses illustrated in (C).
(E) Phenocopy of the snapc3 mutation by antisense morpholino oligonucleotides; splice acceptor (SA) morpholino, transcriptional start site (ATG) morpholino. Scale bars, 10 μm.
(F) The rag1/gh ratios as a measure of thymopoietic activity exemplified in (E) are quantified at 4 dpf (right panel); **, P<0.01; ***, <0.001 (t-test; two-tailed).
(G) In contrast to similar numbers of ikaros-expressing neurons in the hindbrain, the number of ikarosexpressing thymocytes is greatly reduced in snapc3 mutants at 5 dpf. Scale bars, 10 μm.
(H) Characterization of early hematopoiesis. Whole mount RNA in situ hybridization was carried out with the indicated probes at various time points. runx1, 36 hpf. cmyb, 36 hpf; gata1, 24 hpf; l-plastin, 24 hpf. Shown are overviews (left panels) and magnifications (right panels). Scale bars, 50 μm.

