
IMAGE
Fig. 4
Image
|
Figure Caption
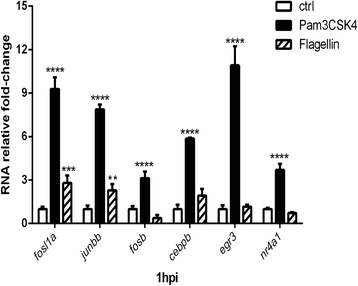
Fig. 4
qPCR analysis of transcription factors genes responsive to PAMPs stimulation. Expression levels of fosl1a, fosb, junbb, cebpeb, egr3 and nr4a1 following Pam3CSK4 and flagellin stimulation are determined by qPCR. Data (mean ± SD) are combined from at least tree biological replicates (n = 15 embryos per group) and expressed relative to their corresponding water control, which is set at 1. Statistical significance was determined by two-way ANOVA analysis and Tukey’s multiple comparisons test, *p < 0.05, **p < 0.01, ***p < 0.001, ****p < 0.0001
Figure Data
Acknowledgments
This image is the copyrighted work of the attributed author or publisher, and
ZFIN has permission only to display this image to its users.
Additional permissions should be obtained from the applicable author or publisher of the image.
Full text @ BMC Genomics