
|
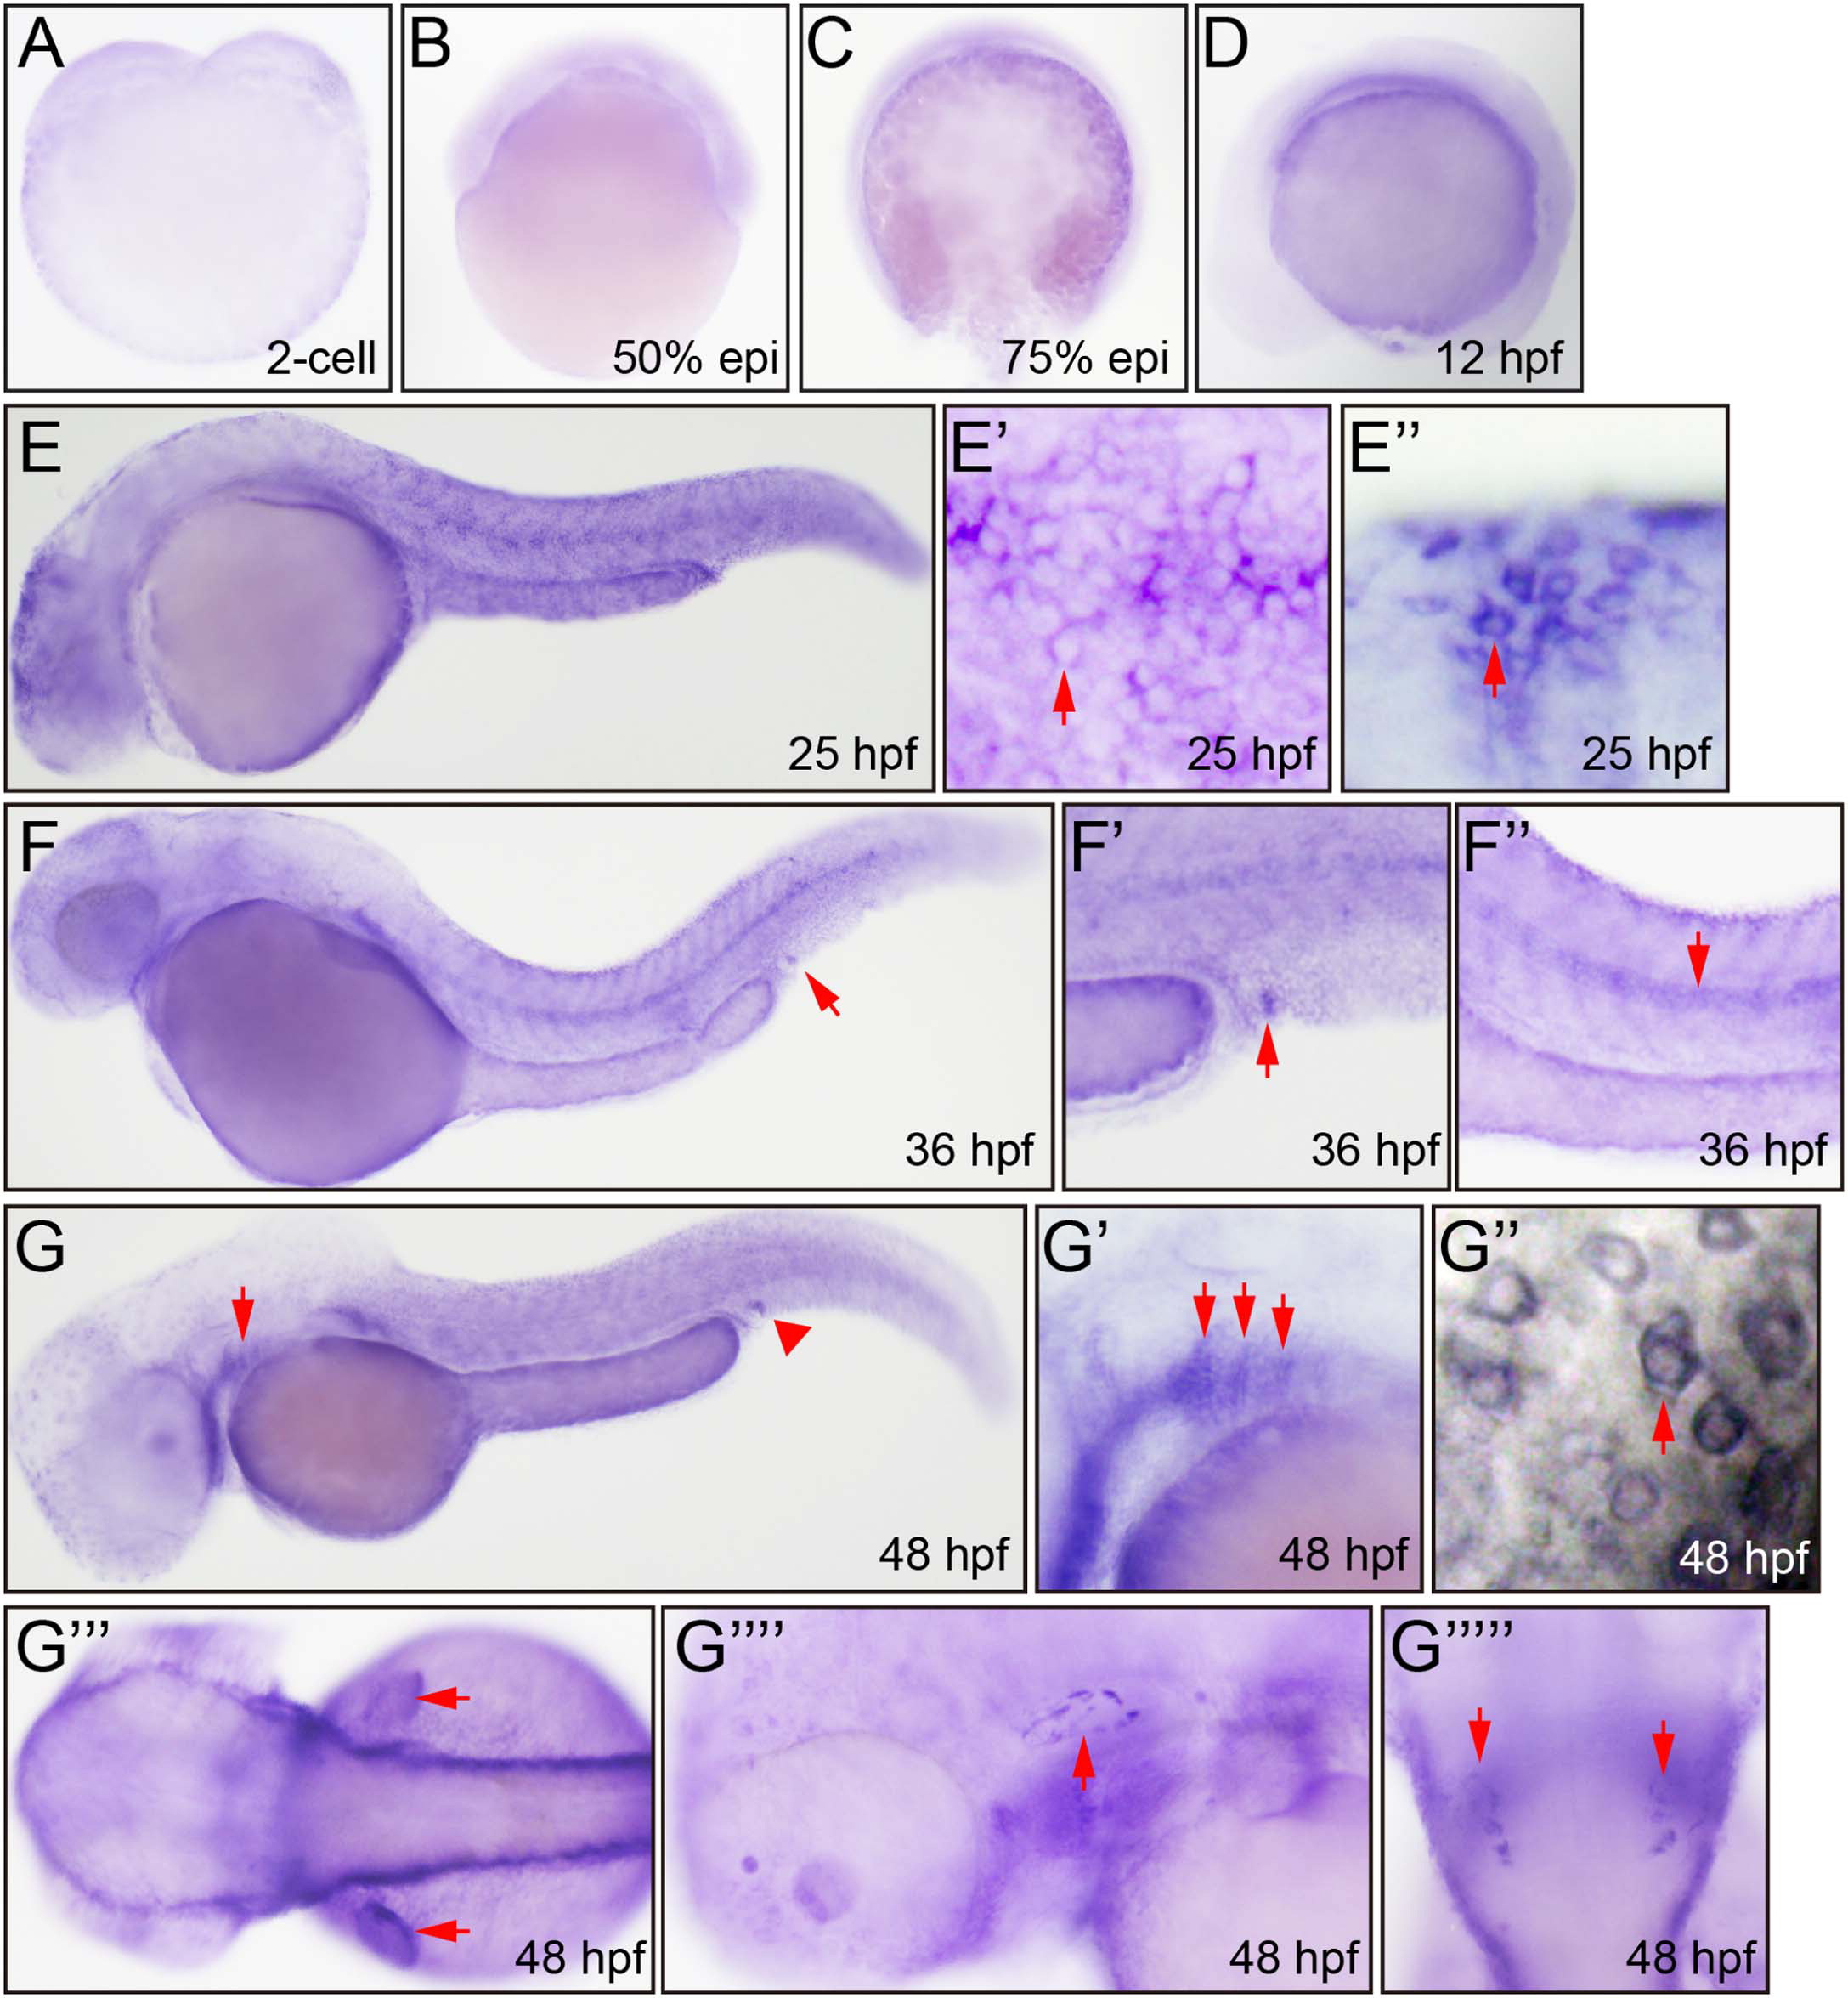
Fig. 4
Whole mount in situ hybridization analysis of zebrafish embryos using antisense itgb1b.2 probe. A. 2-cell, lateral view. B. 50% epiboly, lateral view. C. 75% epiboly, lateral view. D. 12 hpf, lateral view, slightly staining of epidermis. E. 25 hpf, lateral view, epidermis. E′. 25 hpf, lateral view, caudal trunk EVL (arrow). E″. 25 hpf, lateral view, head EVL (arrow). F. 36 hpf, lateral view, urogenital opening (arrow). F′. 36 hpf, urogenital opening (arrow). F″. 36 hpf, lateral view, notochord (arrow). G. 48 hpf, lateral view, branchial arches (arrow), urogenital opening (arrowhead). G′. 48 hpf, lateral view, branchial arches (arrow). G″. 48 hpf, ventral view, head epidermis, EVL (arrow). G‴. 48 hpf, lateral view, pectoral fin epidermis (arrow). G″″. 48 hpf, lateral view, otic vesicle (arrow). G″‴. 48 hpf, dorsal view, otic vesicle (arrow).
Reprinted from Gene expression patterns : GEP, 16(2), Wang, X., Li, L., Liu, D., Expression analysis of integrin β1 isoforms during zebrafish embryonic development, 86-92, Copyright (2014) with permission from Elsevier. Full text @ Gene Expr. Patterns