
|
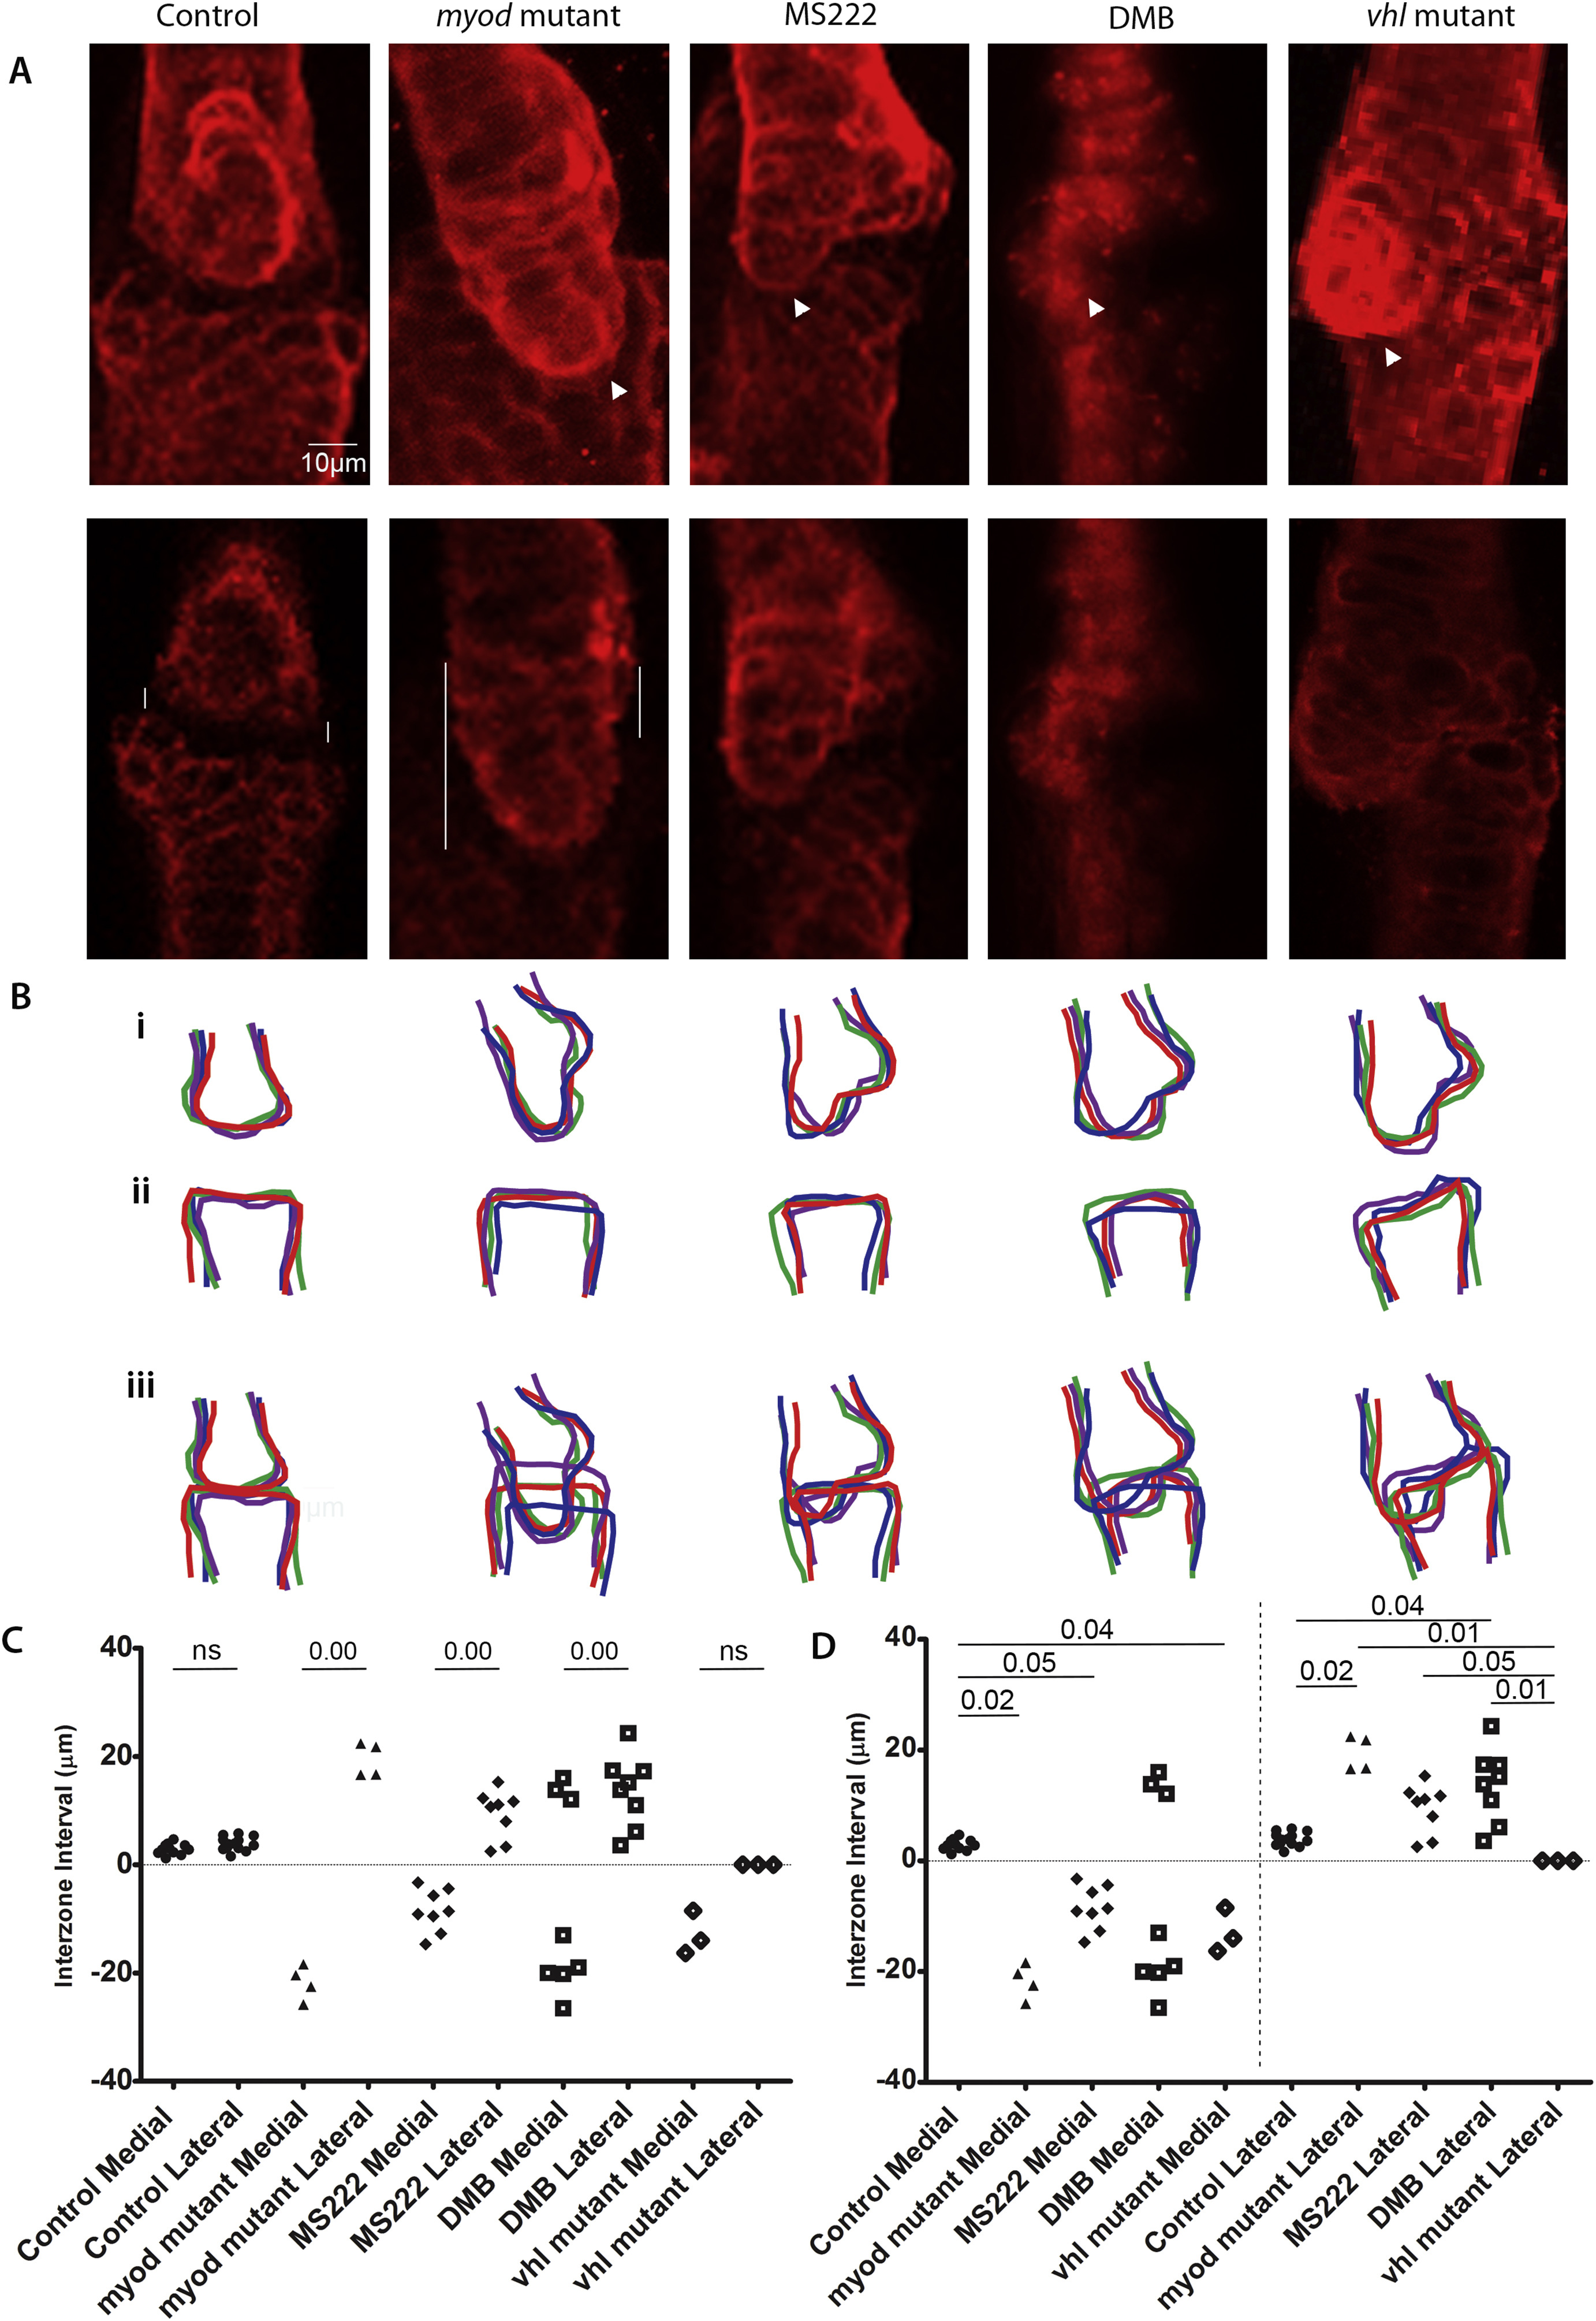
Fig. 2
Muscle paralysis and hyperactivity affect cartilage jaw joint morphology. A) Confocal images of 5dpf zebrafish jaw joints. 5dpf control, myod mutant, 3-5dpf MS222 anaesthetised treated and vhl mutant zebrafish joints were labelled with Collagen II antibody and DMB treated zebrafish cartilage joints were visualised using the Tg(Col2a1aBAC:mcherry) transgenic line. Max projections are shown in the top panel and single z planes of the jaw joint are shown in the lower panel. White arrowheads show the MC overlapping the PQ element. Vertical white lines mark the medial and lateral interzone interval or extent of element overlap between the MC and PQ elements of the jaw joint as measured. Measurements were consistently taken from a mid joint z plane. B). Representative outlines of the 5dpf jaw joint for each condition (n = 4). Meckel's cartilage jaw joint element (Bi), palatoquadrate jaw joint element (Bii) and both elements to show the interaction between the MC and PQ at the jaw joint (Biii). The difference between the interzone interval (μm), on the medial and lateral side of the jaw joint for 5dpf control (n = 13), myod mutant (n = 4), MS222 treated (n = 8), DMB treated (n = 8) and vhl mutant (n = 3) compared in (C). The medial and the lateral interzone intervals are compared between each condition in (D). M, medial; L, lateral. ns = not significant, Significance = P ≤ 0.05.