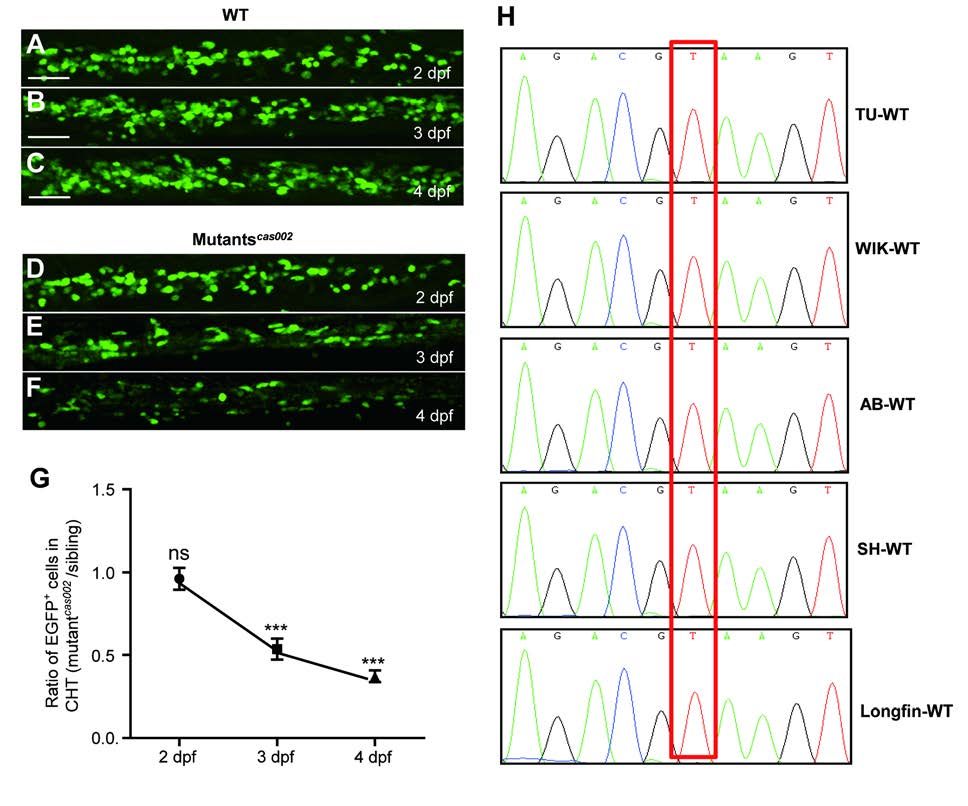
Fig. S6
Mutantscas002 phenotype in Tg (cmyb:egfp) background. (A-F) Representative confocal images of EGFP+ cells in WT and mutantcas002 within Tg (cmyb: egfp) transgenic background. Scale bars: 50 μm. (G) Quantitative analysis of A-F. The number ofEGFP+ cells is comparable in mutant embryos at 2 dpf (p=0.7131). The numbers of EGFP+ cells are decreased in mutant embryos at 3 dpf (p<0.0001) and 4 dpf (p<0.0001). (H) Sequencing electropherogram of the mutation site of kri1l gene genomic DNA from 5 wild-type strains. Genomic DNA were extracted each from 20-30 embryos of TU, AB, WIK, Longfin and Shanghai strains, and were then sequenced for kri1l gene. This point mutation (T-G) in kri1lcas002 was not found in all five wild-type strains, indicating that T-G transition at the site is not a SNP.

