
|
Fig. S2
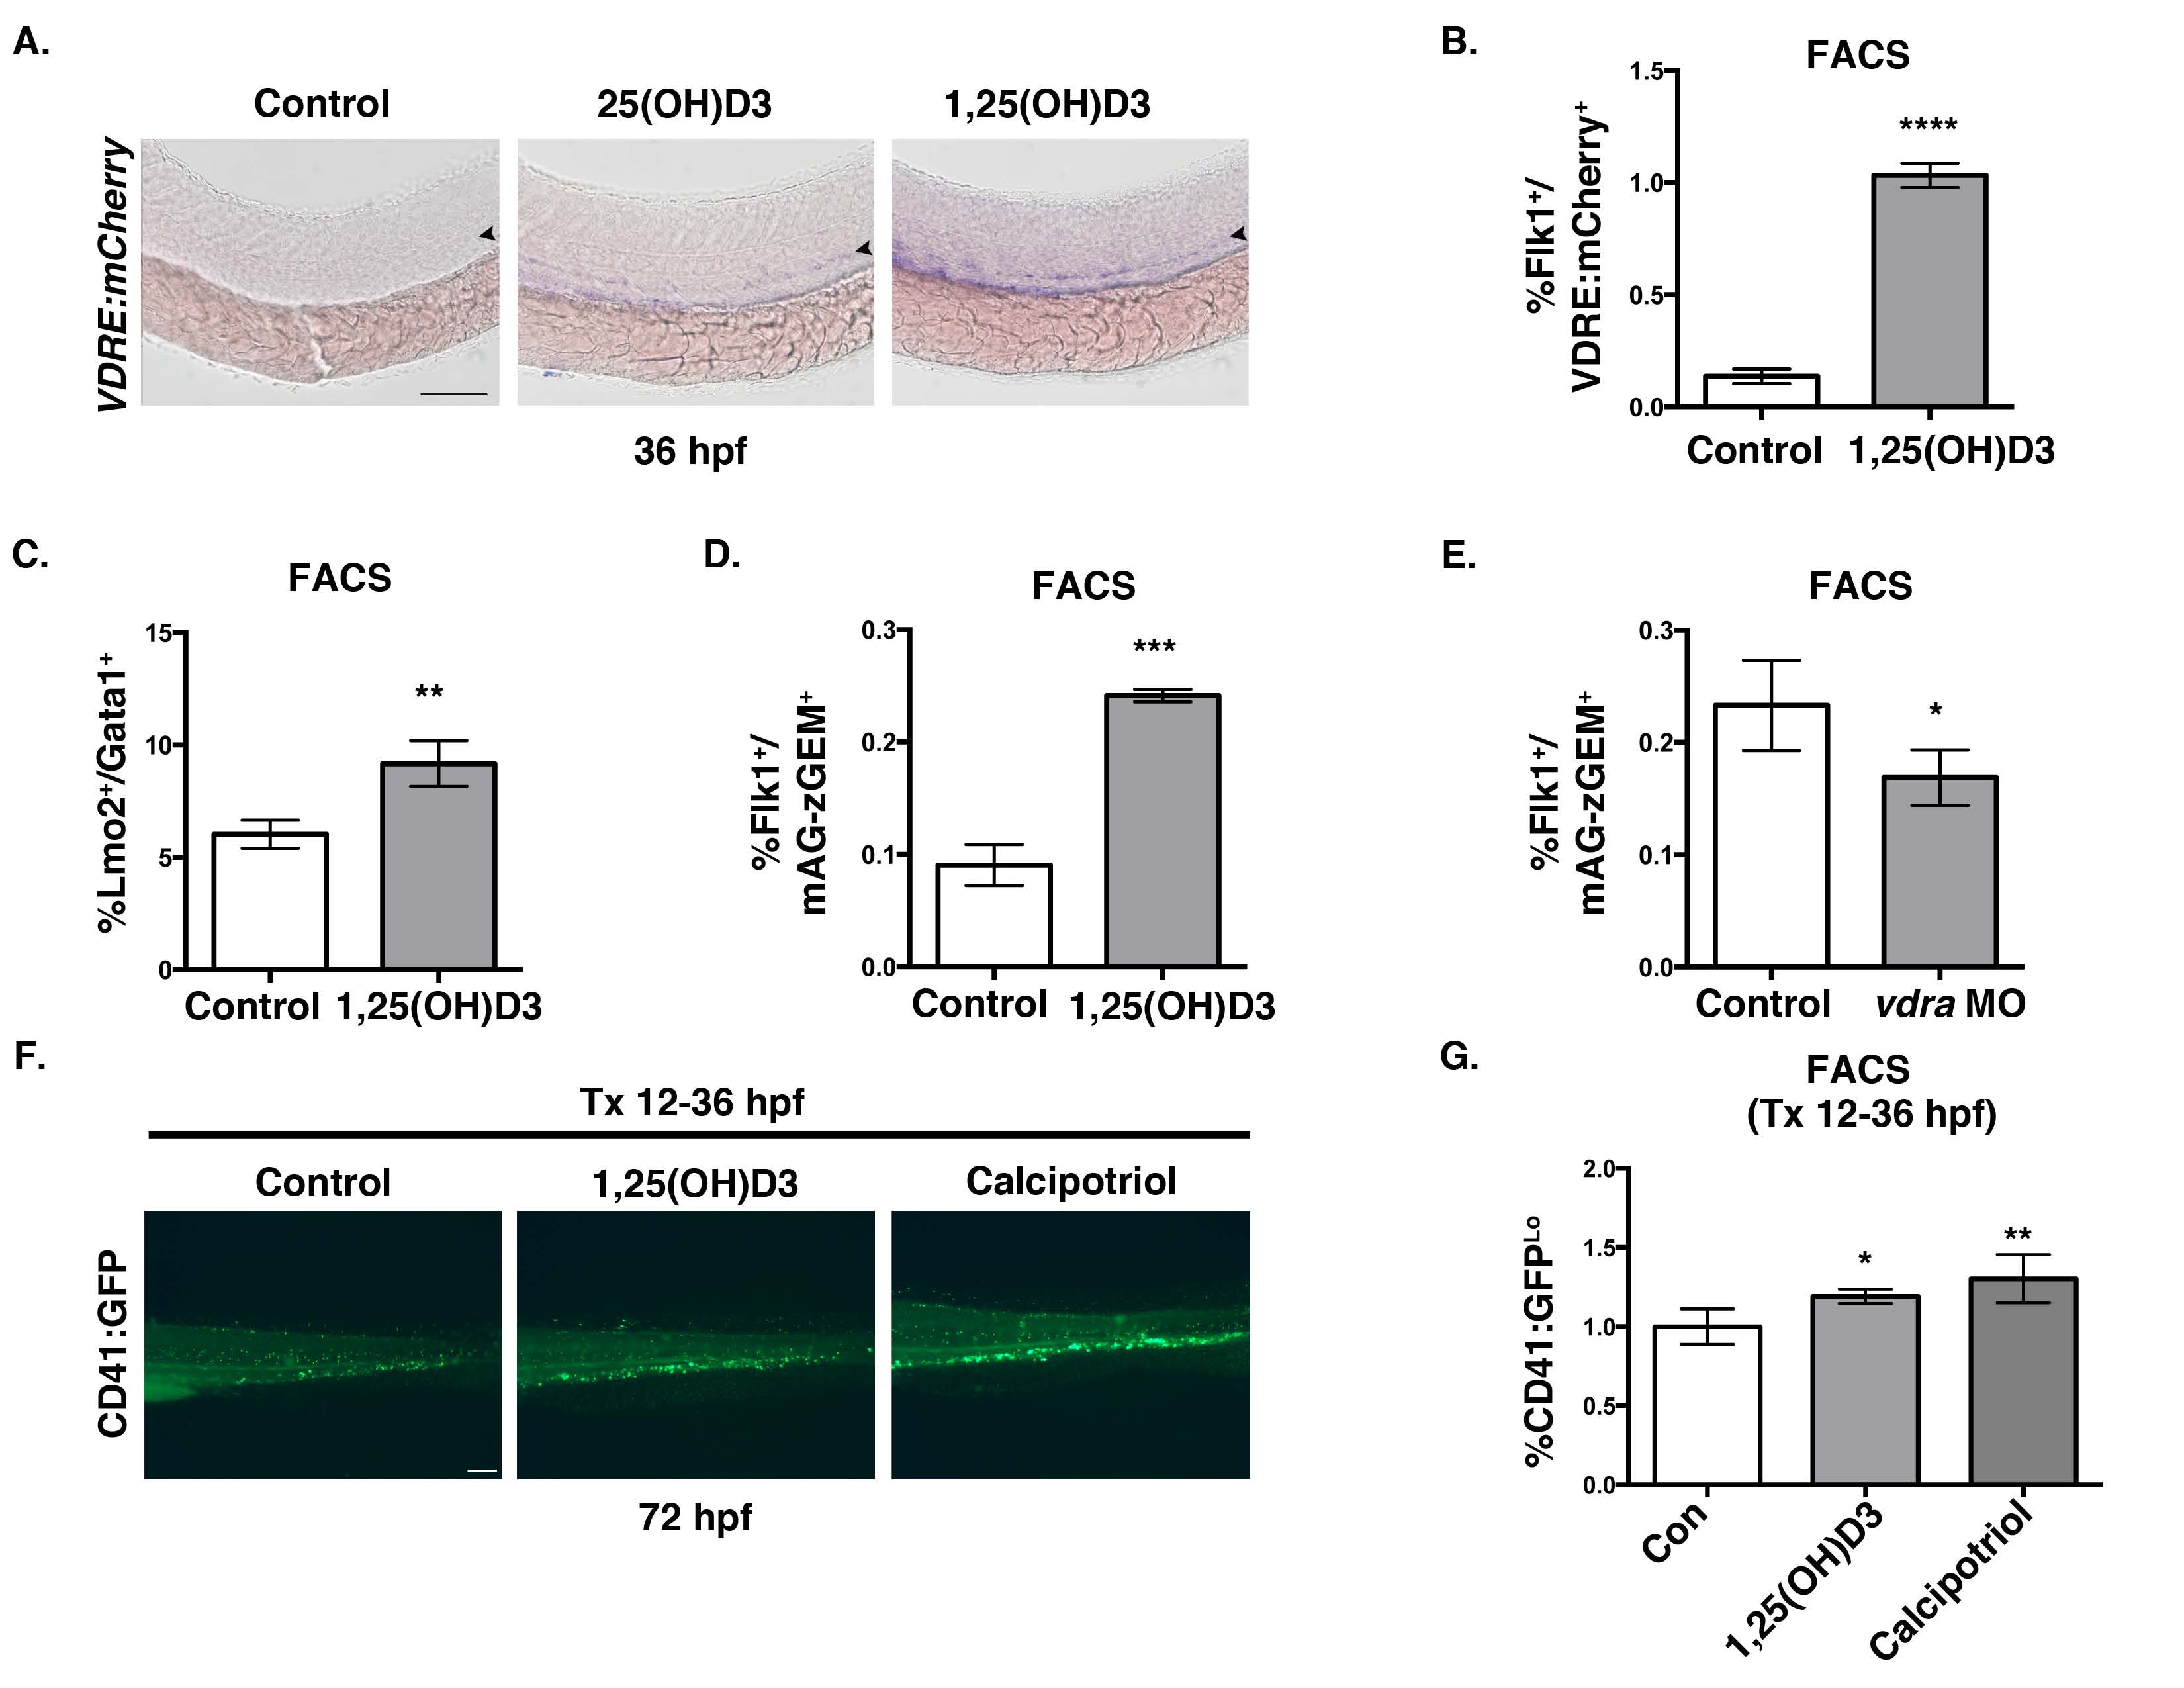
Vitamin D treatment expands HSPC number (related to Figure 2).
A. Representative VDRE:mCherry WISH phenotype of embryos treated with 25(OH)D3 and 1,25(OH)D3 compared to DMSO-treated controls (n>10).
B. FACS analysis of Tg(flk1:GFP/VDRE:mCherry) embryos treated with 1,25(OH)D3 from 12-36hpf showed a significant (****p<0.0001) increase in Flk1+ cells responsive to 1,25(OH)D3 (5 embryos/sample x 4 replicates/condition); error bars, mean± SD).
C. FACS analysis of embryos treated with 1,25(OH)D3 (10μM) indicated a 25% increase in EMPs at 30hpf (**p<0.01) compared to controls (n value and error bars as in S2B).
D. FACS analysis of 1,25(OH)D3-treated Tg(flk1:dsred; EF1:mAG-zGEM(1/100) embryos at 36hpf showed a 2-fold increase (***p<0.001) in proliferating endothelial cells, inclusive of the hemogenic population (5 embryos/sample x 4 replicates/condition); error bars, mean ± SD.
E. FACS analysis of vdra MO-injected Tg(flk1:dsred; EF1:mAG-zGEM(1/100) embryos at 36hpf indicated a significant decrease in proliferation (*p<0.05) in the absence of Vitamin D3/VDR signaling (n value and error bars as in S2D).
F. Representative fluorescent microscopy images of Tg(CD41:GFP) embryos treated with 1,25(OH)D3 (1μM) or calcipotriol (1μM) between 12-36hpf depicting a sustained increase in CD41:GFP+ expression in the CHT at 72hpf.
G. FACS analysis at 72hpf showed a significant increase in the percentage of CD41:GFPlo;Gata1:dsRed- HSPCs after both 1,25(OH)D3 (*p<0.05) and calcipotriol (**p<0.01) treatment (5 embryos/sample x 4 replicates/condition); error bars, mean ± SD.
Scale bar 100μm.