Fig. 6
Fig. 6
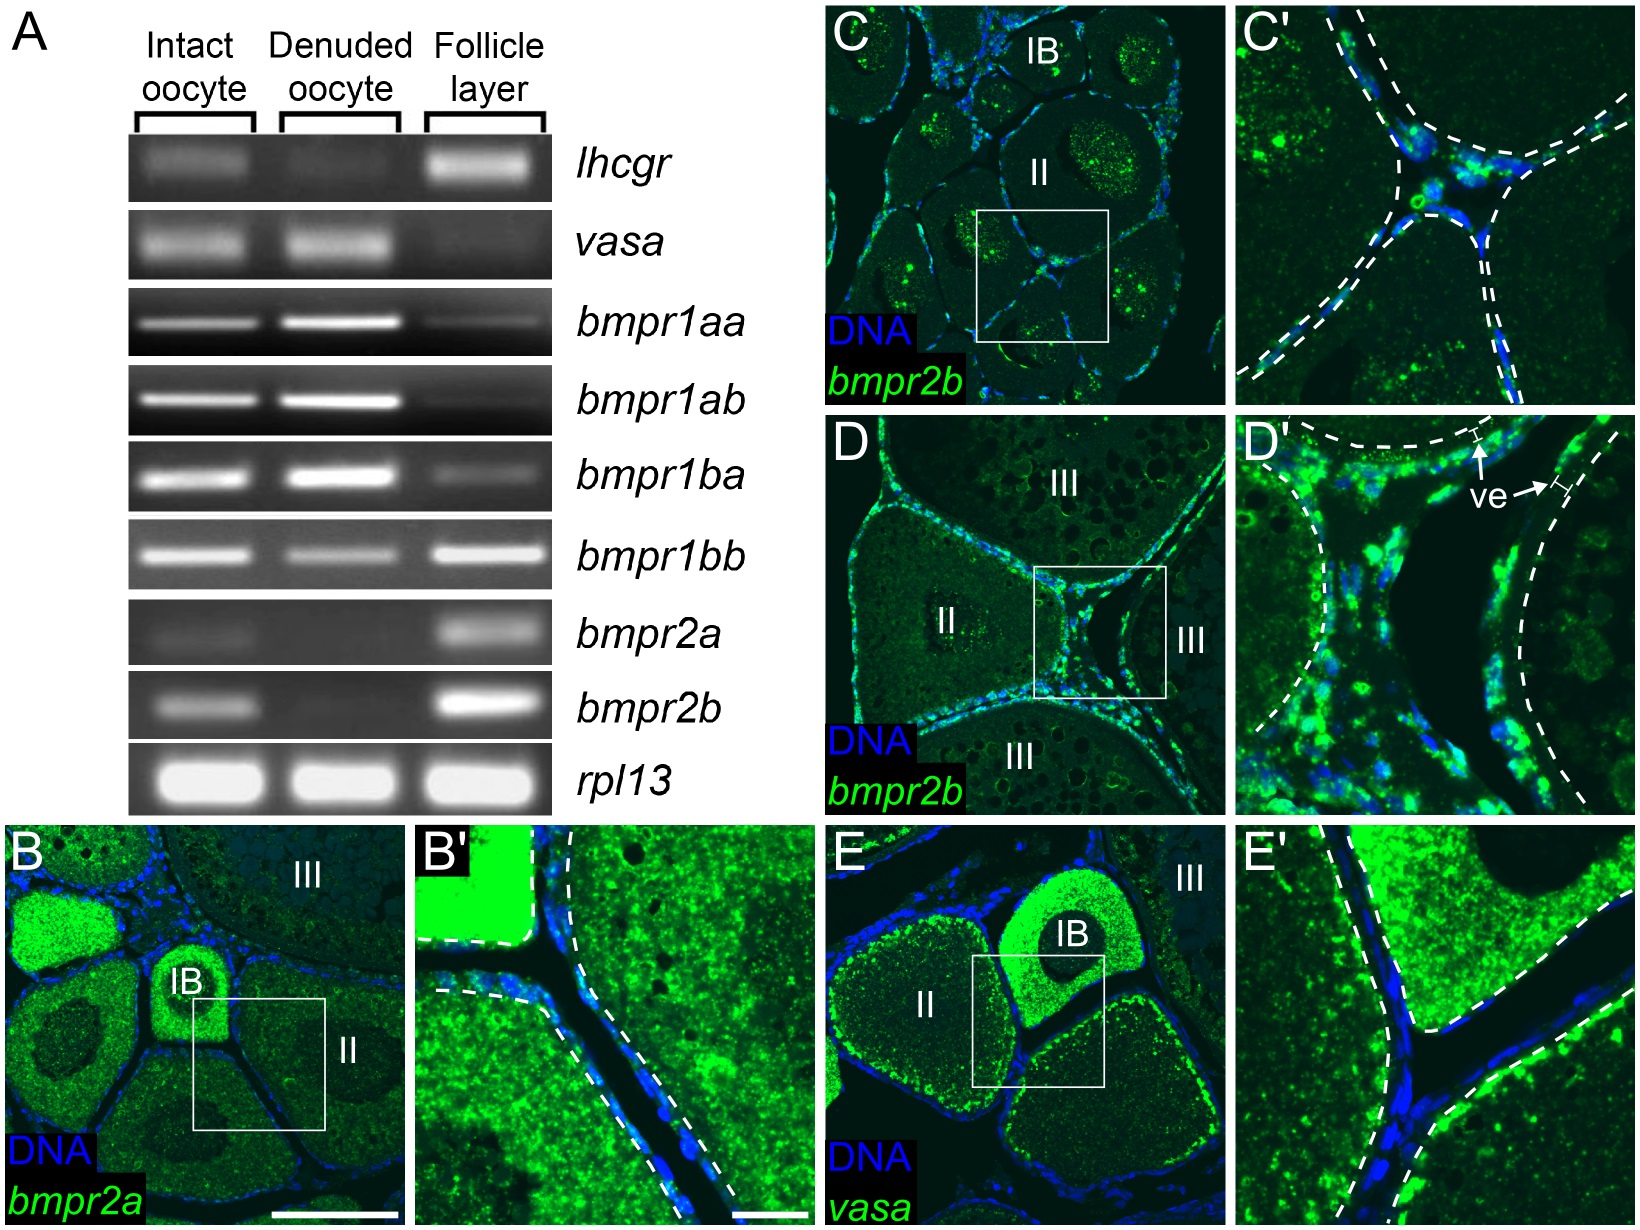
(A) RT-PCR profiling of BMP receptor family members in ovarian tissue. Intact oocyte (consisting of oocyte plus associated follicle cells; left column) were mechanically separated into denuded oocyte (middle column) and follicle cell layer (right column). Reference genes mark follicle cells (lhcgr) and oocytes (vasa). Expression of the Type I receptor bmpr1bb and the Type II receptors bmpr2a and bmpr2b is selectively enriched in follicle cells. rpl13 is shown as an amplification control. High resolution fluorescent RNA in situ hybridization reveals that bmpr2a (green in B) is expressed in early oocytes and in the somatic gonad cells that surround them; bmpr2b (green in C, D) is expressed in somatic gonad cells that surround all oocytes; vasa (green in E) is only expressed in oocytes (B′-E′ are higher magnification views of areas boxed in B-E, respectively). In all panels DNA in blue. Dotted lines in B′-E′ mark the oocyte membrane; ve, vitelline envelope; IB, II and III denote oocyte stages. Scale bars: 100 µm (B-E), 20 µm (B′-E′).

