Fig. 1
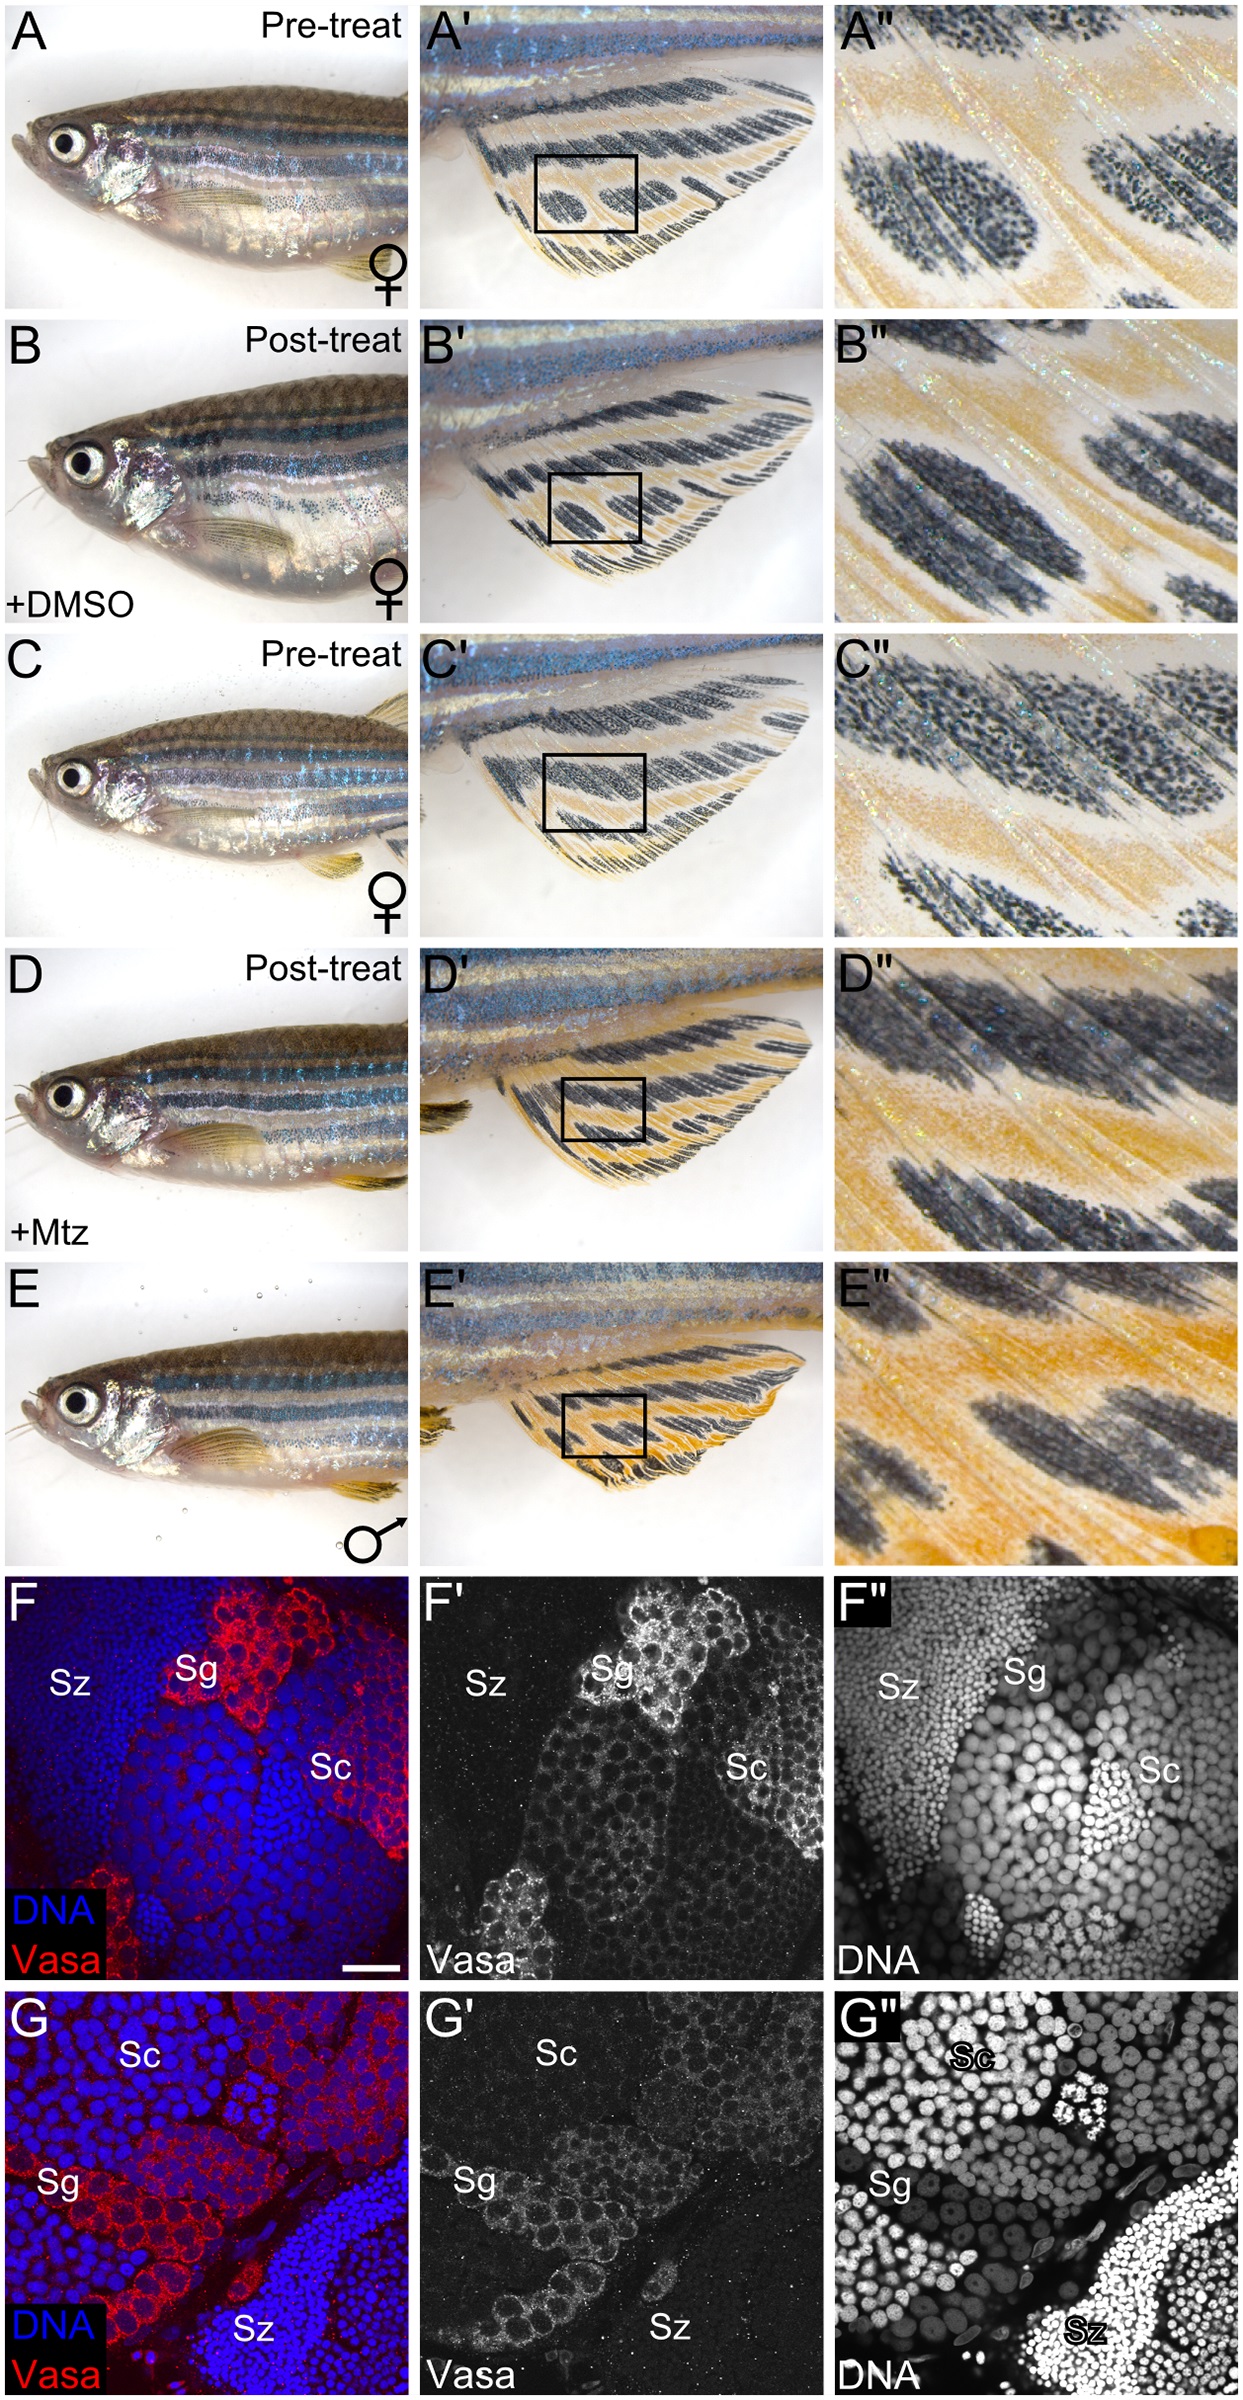
(A-A′′) Representative Tg(zp3:CFP-NTR) female prior to control DMSO-treatment and the same fish (B-B′′) post-treatment. Female zebrafish (A-B′′) have large, egg-filled abdomens and light yellow fin pigmentation. (C-C′′) Representative Tg(zp3:CFP-NTR) female prior to Mtz treatment and the same fish (D-D′′) two months after Mtz treatment. Note that the post-treatment fish has a slimmer body and darker yellow fin pigmentation characteristic of a DMSO-treated control male (E-E′′). (F-G′′) Confocal images of testes isolated from a normal male (F-F′′) and a representative sex-reverted Tg(zp3:CFP-NTR) (G-G′′) fish. (F, G) Merged images: Vasa protein in red, DNA in blue. (F′, G′) Vasa protein only. (F′′, G′′) DNA only. (A′-E′) Magnified view of the anal fin. (A′′-E′′) Magnified view of the regions boxed in A′-E′. Sg, spermatogonia; Sc, spermatocytes; Sz, spermatozoa. Scale bar: 20 µm (F-G′′).

