Image
Figure Caption
Fig. 4
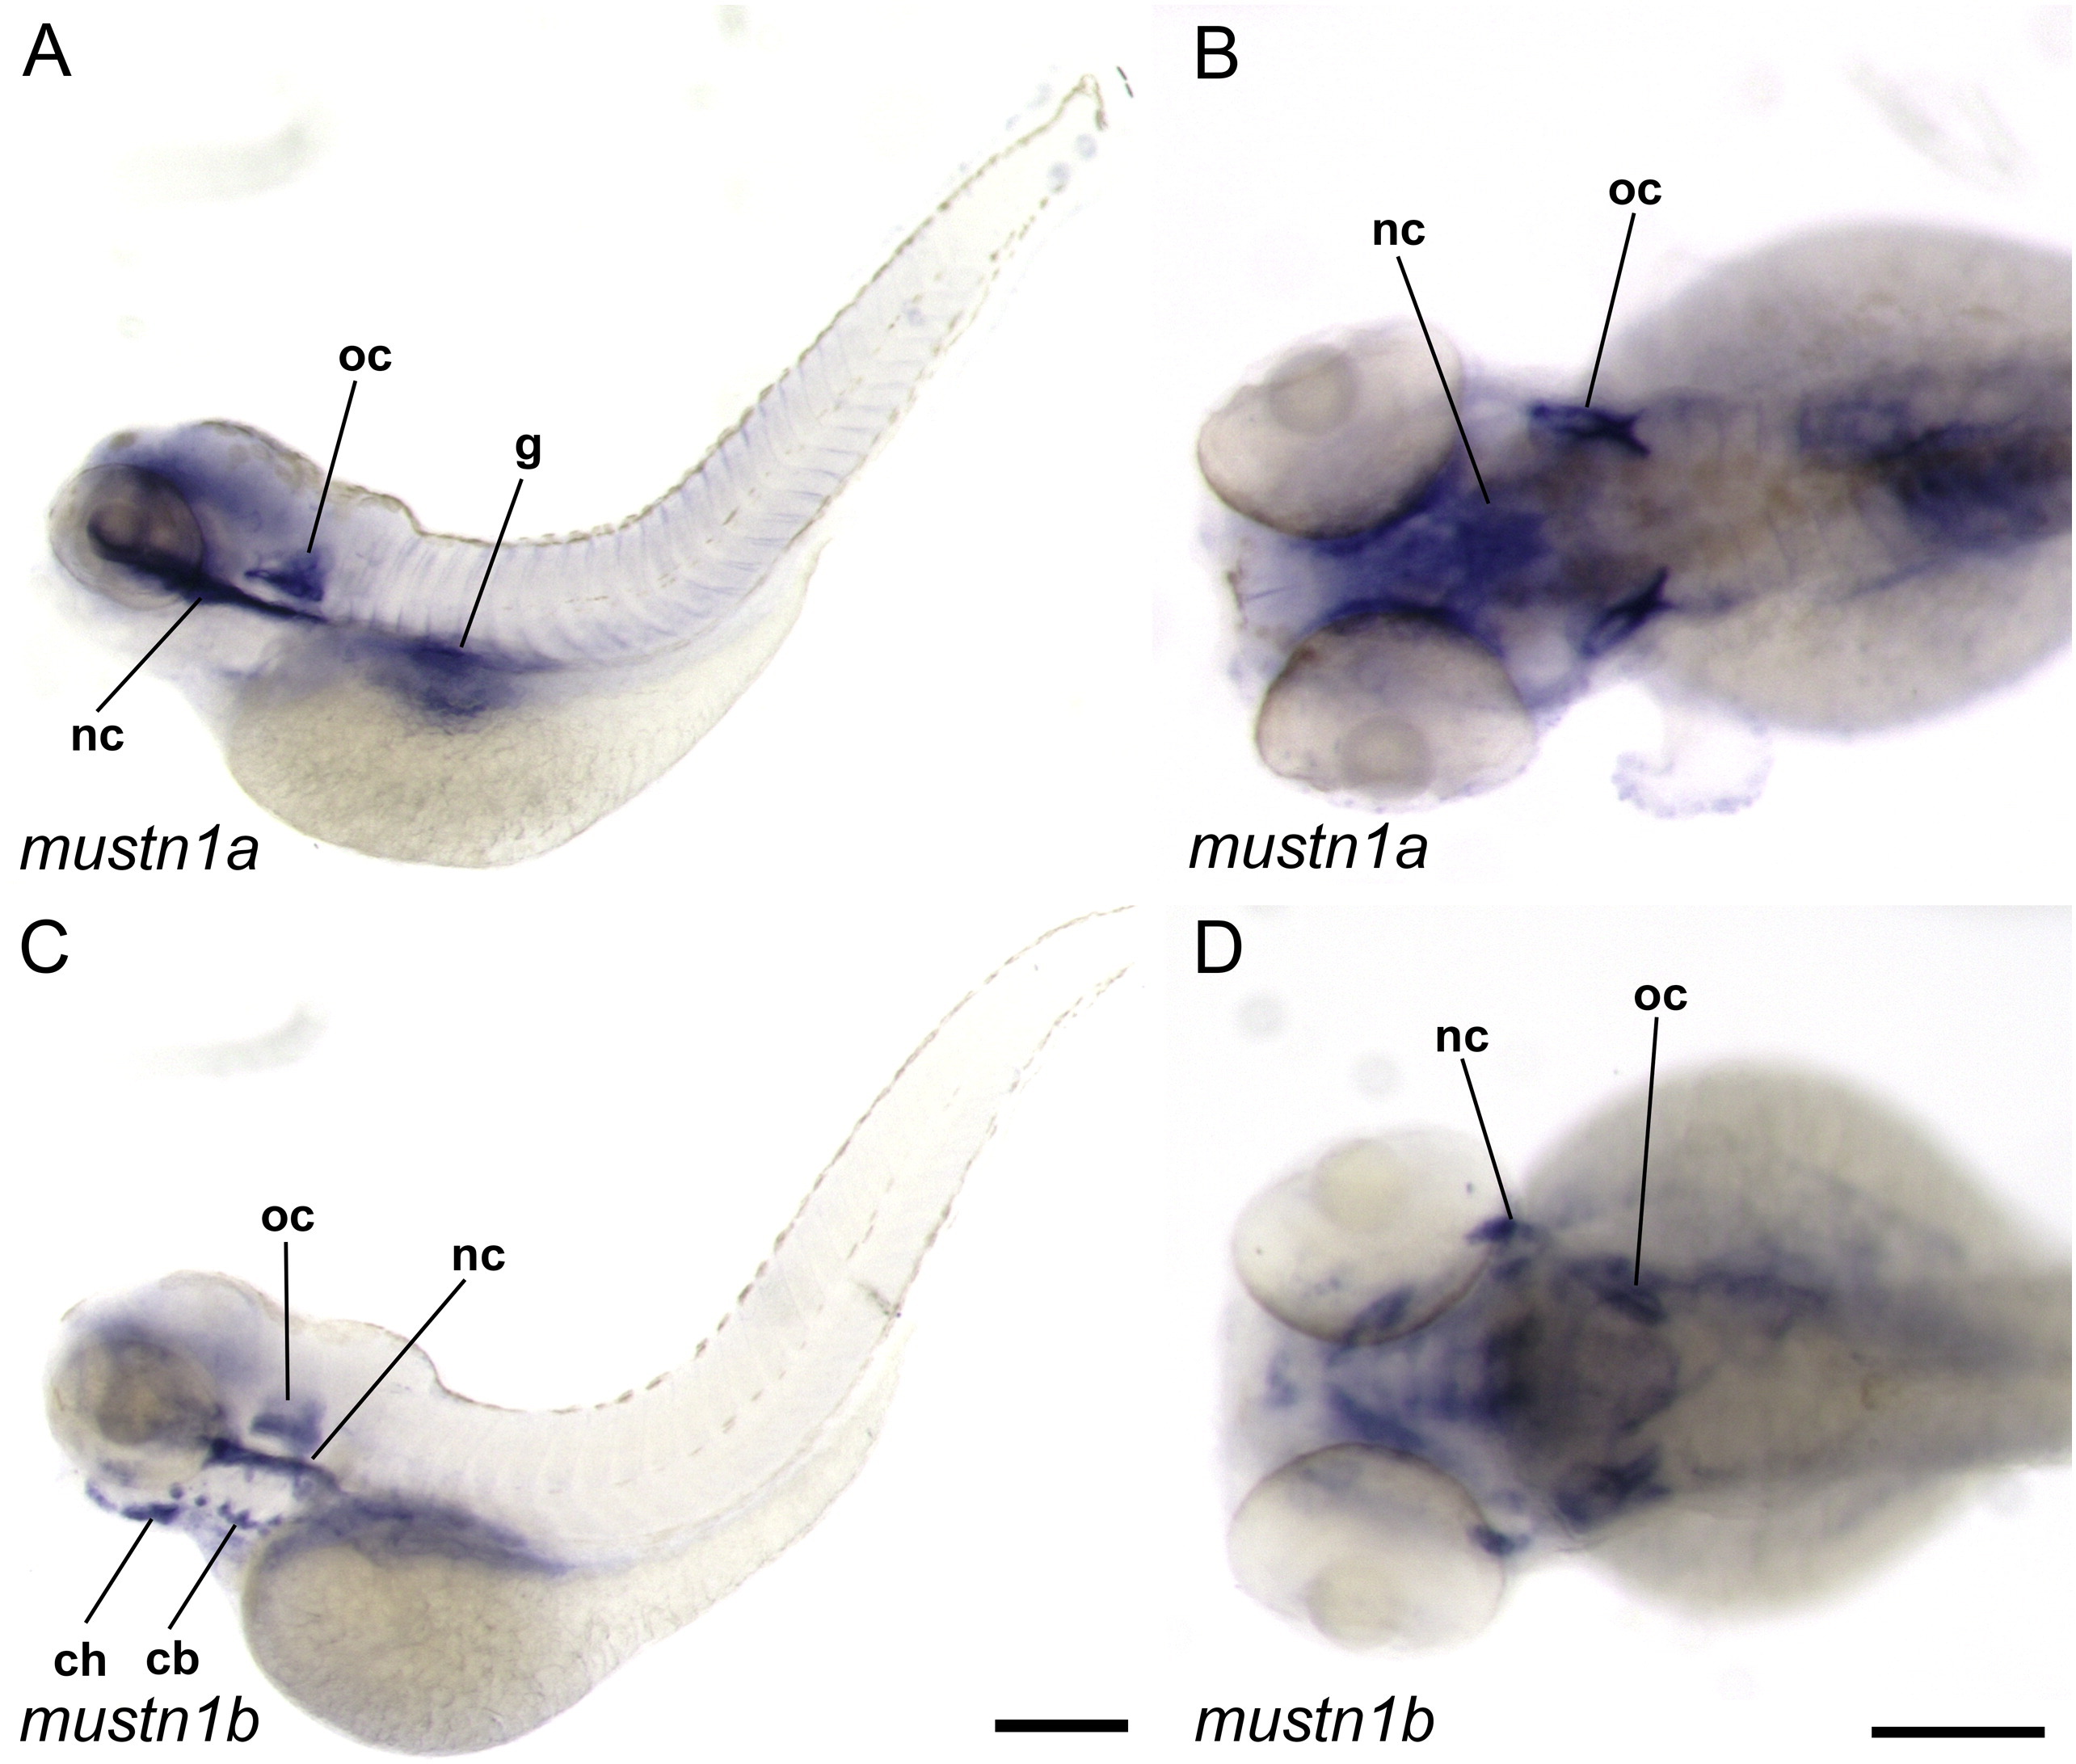
Expression of mustn1a (A-B) and mustn1b (C-D) 120 hpf (5 days post-fertilization). (A) Lateral view of mustn1a with pronounced expression in the otic capsule (oc), neurocranium (nc), and gut (g). (B) Dorsal view of head region showing mustn1a mRNA in the developing neurocranial structures. (C) Lateral view of mustn1b with expression in the otic capsule (oc), neural cranium (nc), ceratohyal (ch), and ceratobranchial (cb). (D) Dorsal view of head showing mustn1b mRNA distribution in developing skeletal structures. Scale bar = 200 µm.
Figure Data
Acknowledgments
This image is the copyrighted work of the attributed author or publisher, and
ZFIN has permission only to display this image to its users.
Additional permissions should be obtained from the applicable author or publisher of the image.
Reprinted from Gene, 593(1), Camarata, T., Vasilyev, A., Hadjiargyrou, M., Cloning of zebrafish Mustn1 orthologs and their expression during early development, 235-41, Copyright (2016) with permission from Elsevier. Full text @ Gene

