
Image
|
Figure Caption
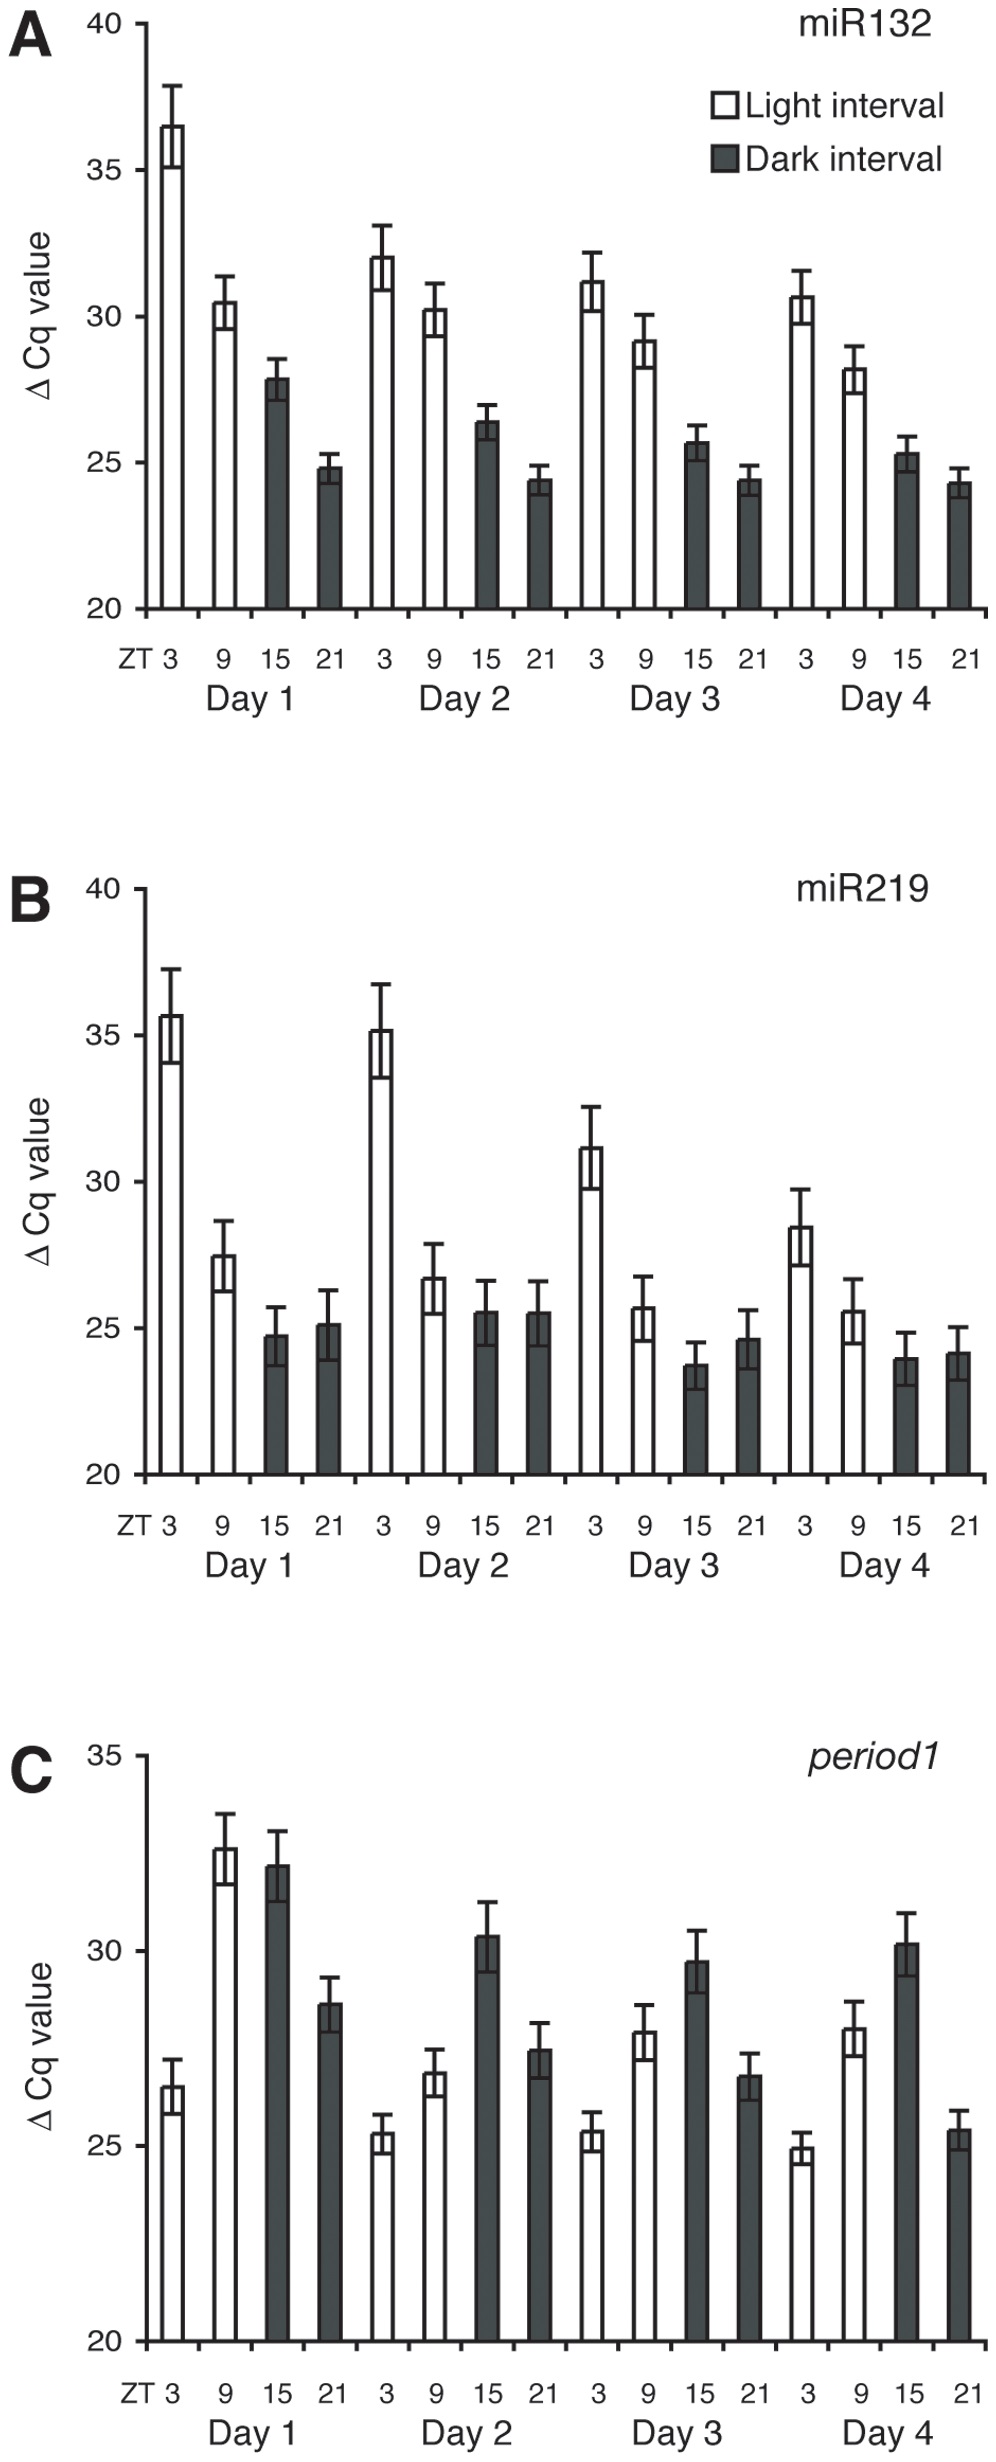
Fig. 3
miR219 and miR132 temporal expression pattern.
(A) qPCR analysis showing the temporal oscillation of miR132 and (B) miR219 transcription during the first four days of development in embryos raised under a 12612 LD cycle. (C) Expression of period1 under the same conditions. White bars indicate the light and black bars the dark intervals. Note that low cycle quantification (Cq) values indicate high transcript levels and vice versa.
Figure Data
Acknowledgments
This image is the copyrighted work of the attributed author or publisher, and
ZFIN has permission only to display this image to its users.
Additional permissions should be obtained from the applicable author or publisher of the image.
Full text @ PLoS One