
|
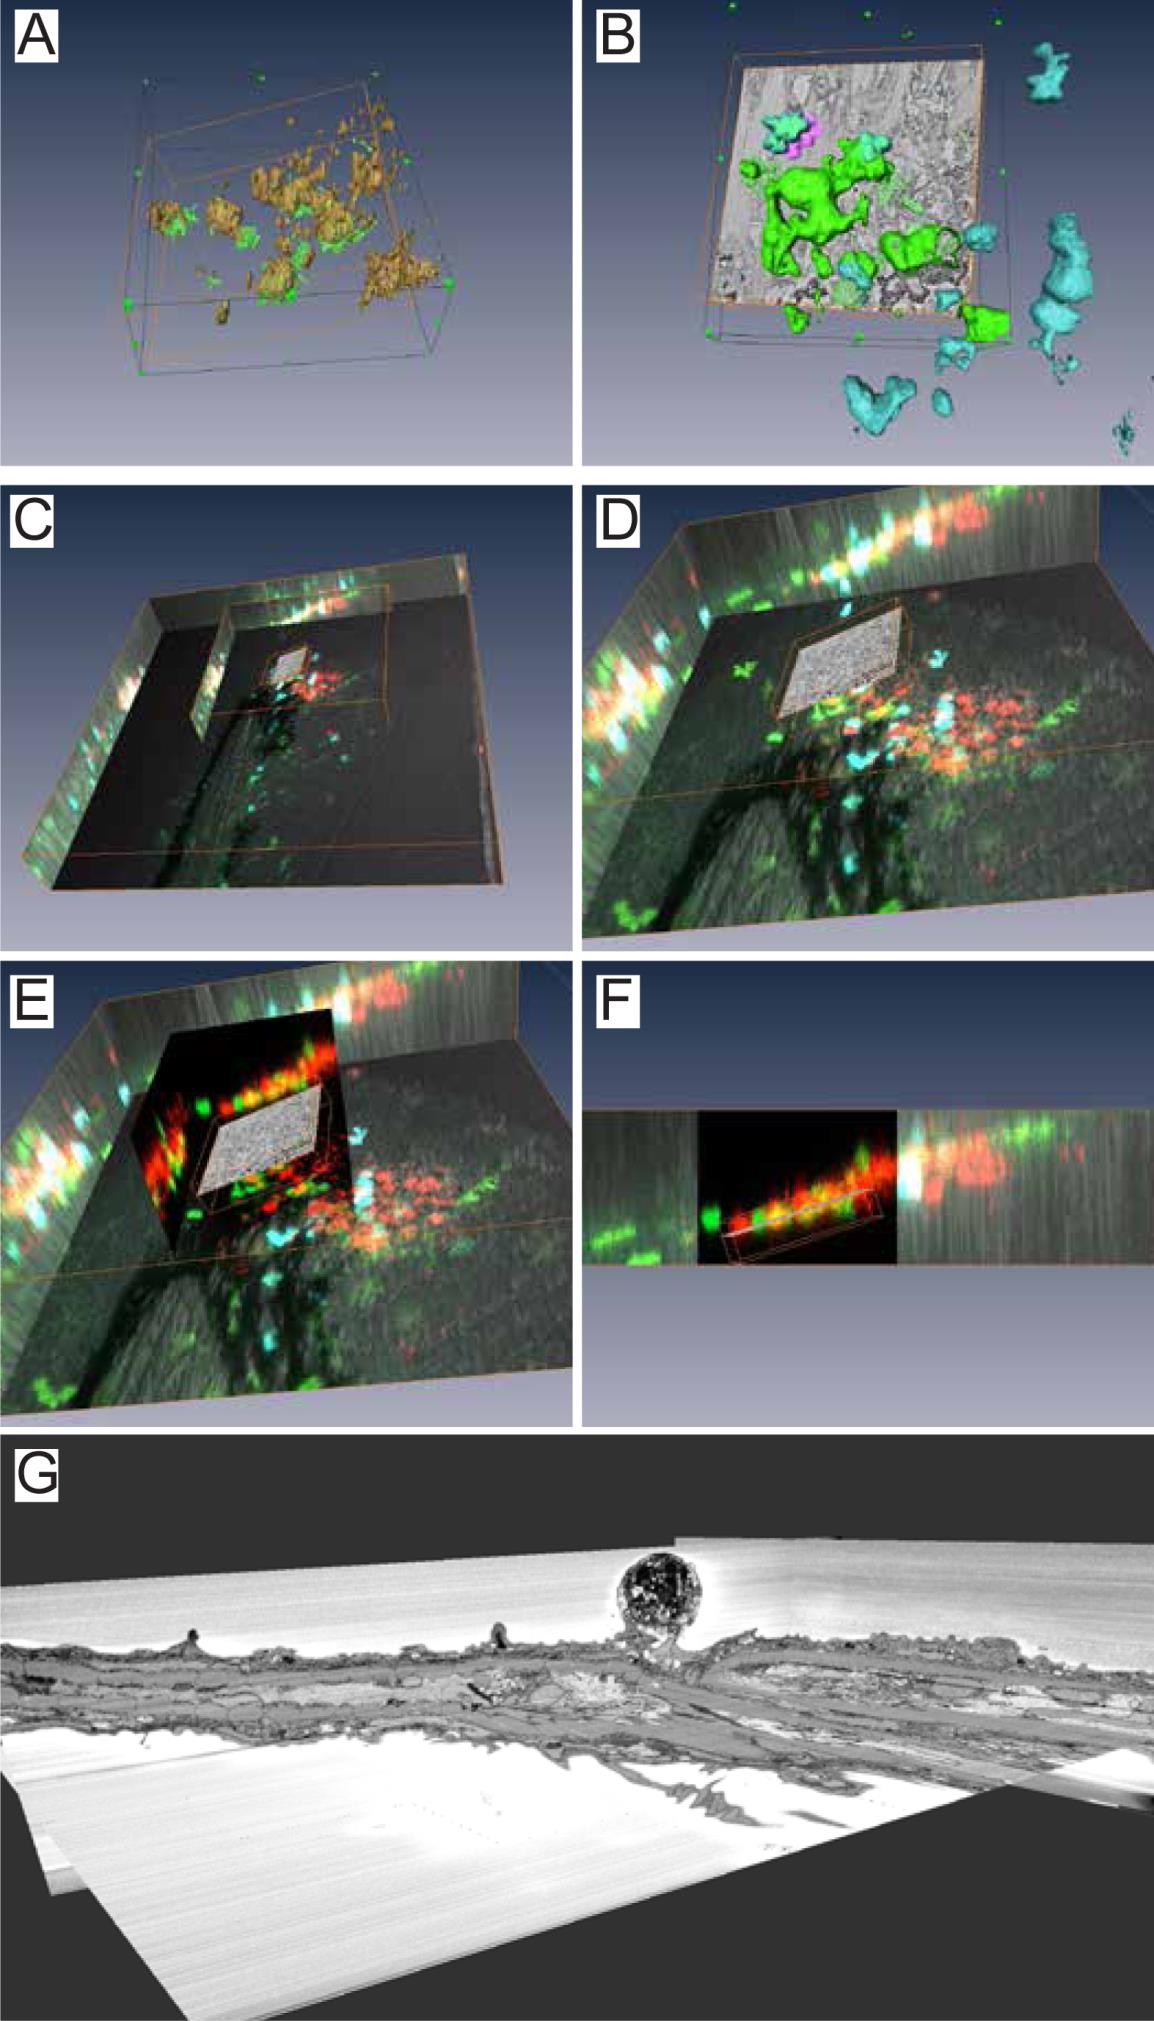
Fig. S4
Correlation of the CLSM and 3D block-face SEM images. A) Alignment of Mm volumes imaged by CLSM and BF-SEM. The Mm in BF-SEM images were segmented and the 3D rendered surface of this segmentation is shown in green. The 3D rendered surface of the fluorescent signal obtained using CLSM is shown in yellow. B) Surface rendering of the macrophage (green) and neutrophil (blue) fluorescent signal was used after alignment to localize the macrophages and neutrophils in BF-SEM images. C-F) Aligned BF-SEM images projected in the 3D CLSM images shown from different angles. G) Orthogonal slices of BF-SEM images showing extrusion of a Mm aggregate from the outer epithelial layer.