
Image
|
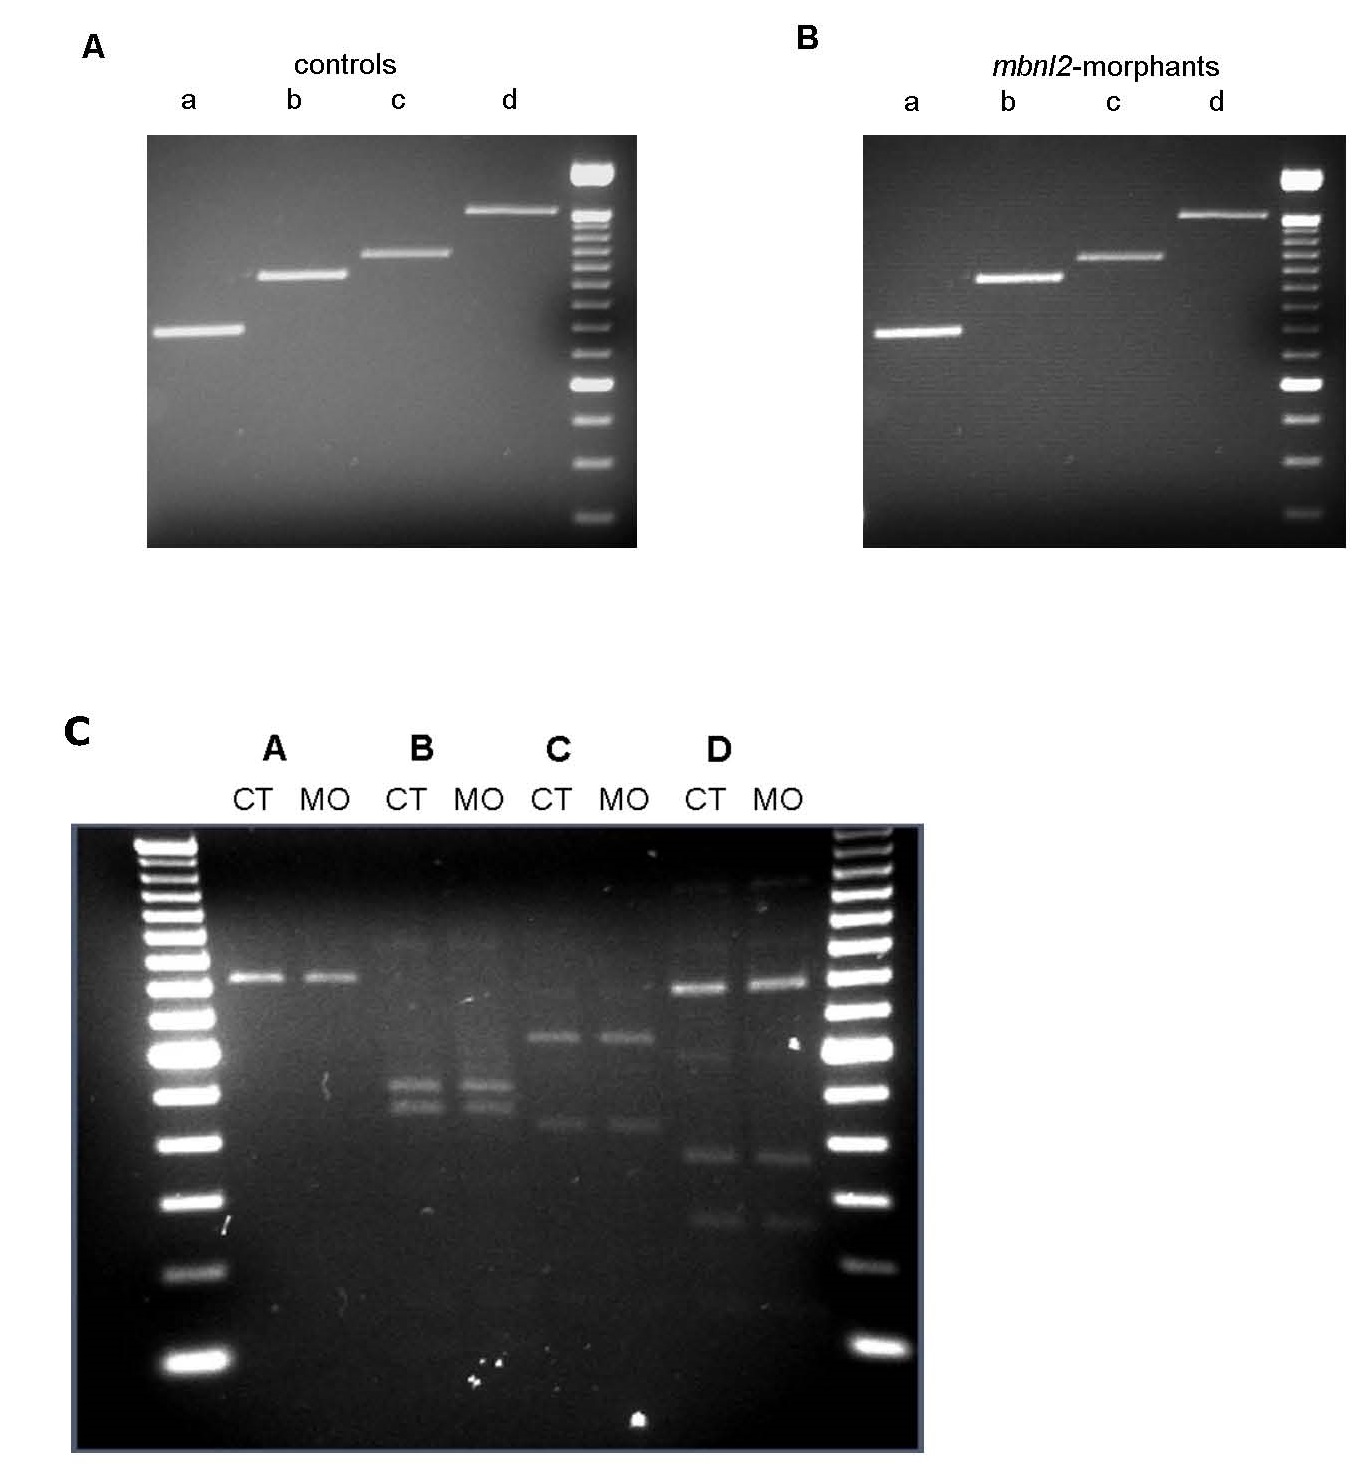
Figure Caption
Fig. S8
Expression analysis of zebrafish scn4ab. RT-PCR assays carried out in 51 hpf control (A) and morphant (B) zebrafish embryos. No difference in product size was found when using four different sets of primers (a, b, c, d). Last lane to the right contains a 100 bp ladder. (C) Purified RT-PCR products (a, b, c and d) were analyzed by a combination of restriction enzyme digests. The sizes of the restriction products obtained from 51 hpf controls (CT) and morphants (MO) are listed in Table S1.
Figure Data
Acknowledgments
This image is the copyrighted work of the attributed author or publisher, and
ZFIN has permission only to display this image to its users.
Additional permissions should be obtained from the applicable author or publisher of the image.
Full text @ Dis. Model. Mech.