Image
Figure Caption
Fig. S5
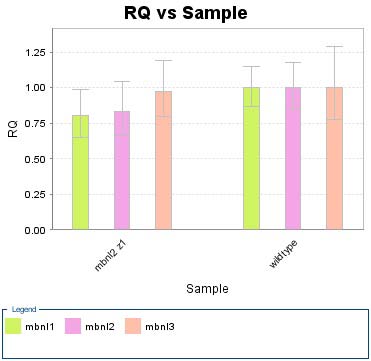
Quantitative RT-PCR analysis of mbnl2 MO-1 treated embryos showed that knockdown of mbnl2 does not significantly affect the levels of mbnl1 or mbnl3. The bar graph shows the relative expression levels of mbnl1 (green), mbnl2 (pink) and mbnl3 (salmon). Each gene was assessed in triplicate in three biological replicates. The procedure is described fully in supplementary methods.
Figure Data
Acknowledgments
This image is the copyrighted work of the attributed author or publisher, and
ZFIN has permission only to display this image to its users.
Additional permissions should be obtained from the applicable author or publisher of the image.
Full text @ Dis. Model. Mech.

