
Fig. 7
|
Fig. 7
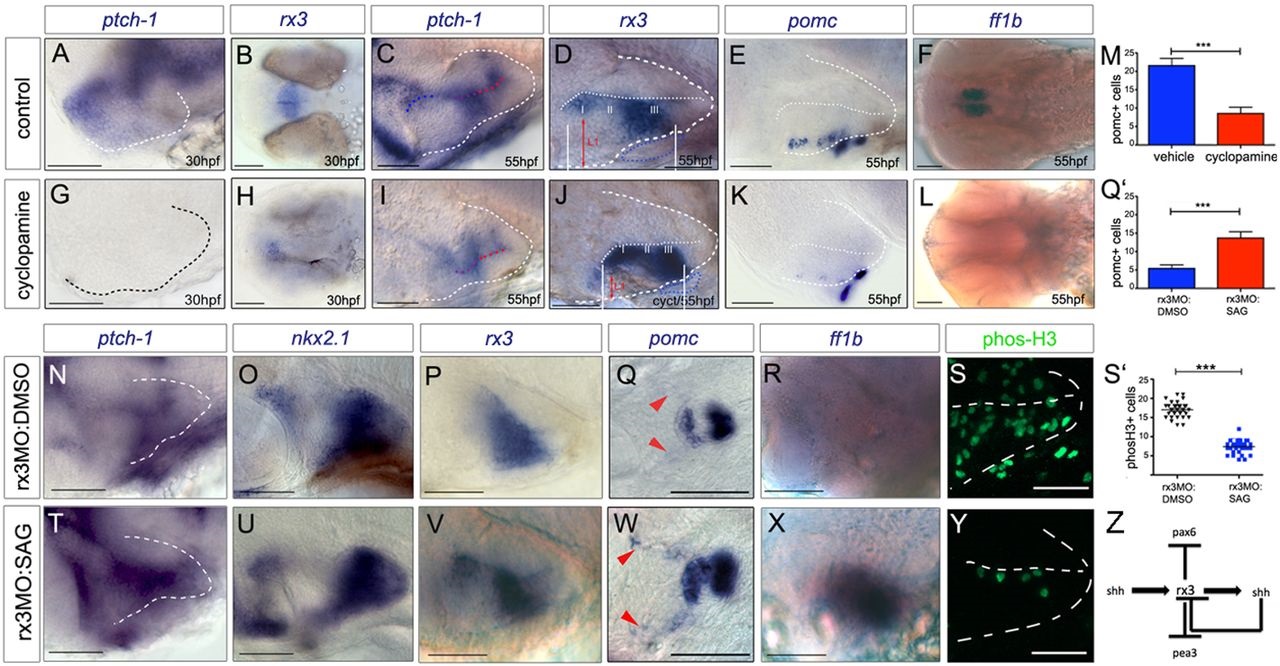
Shh signalling functions as an rx3 ‘on-off’ switch. (A-L) Side or ventral views of 30hpf and 55hpf wild-type embryos, exposed to vehicle or cyclopamine over 10-28hpf (A,B,G,H) or over 28-55hpf (C-F,I-L). Red arrows and white bars in D,J show distances measured for width and length of tuberal/anterior hypothalamus. (M) Quantitative analysis: significantly fewer pomc+ cells are detected after cyclopamine exposure (***P<0.0001, n=30 embryos). (N-Y) Side or ventral views of 55hpf rx3 morphant embryos, exposed to DMSO vehicle (N-S) or SAG (T-Y) from 28hpf. (Q′,S′) Quantitative analysis. Significantly more pomc+ cells (Q′; ***P<0.0001, n=30 embryos) and significantly fewer phosH3+ cells (S′; ***P<0.0001, n=27 embryos) are detected after late SAG rescue. (Z) Model for anterior/tuberal progenitor development. Scale bars: 50µm.