
|
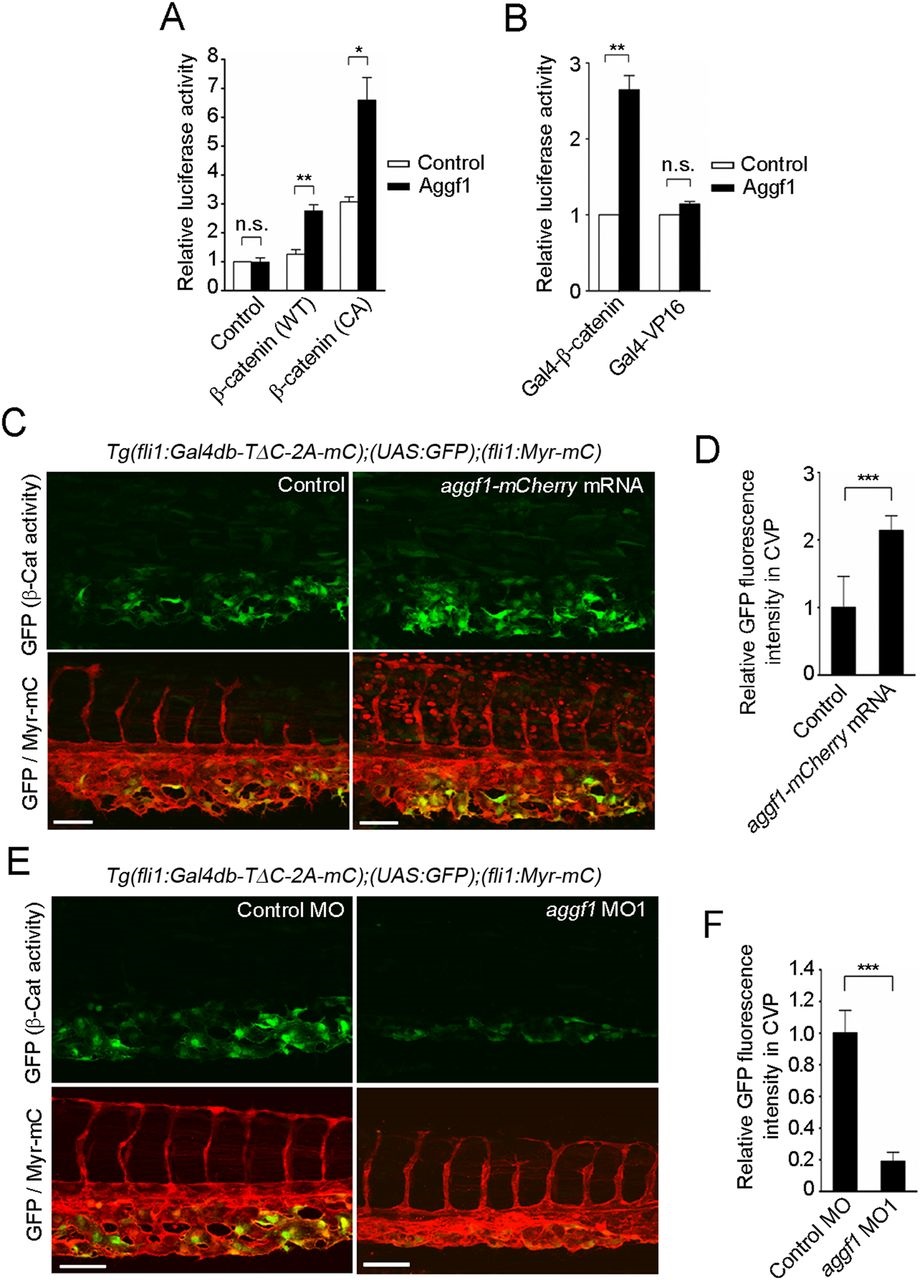
Fig. 5
Aggf1 functions downstream from Bmp to stimulate β-catenin transcriptional activity during CV formation. (A) Relative TOPflash/FOPflash activity in HEK 293 cells transfected with empty vector (control) or plasmid encoding either wild-type (WT) or constitutively active (CA) β-catenin together with the empty plasmid (control) or that expressing Aggf1. Data are shown relative to that in the empty vector-transfected cells, as the mean±s.e.m. of three independent experiments. (B) Relative luciferase activity in HEK 293 cells transfected with UAS-luciferase reporter and plasmid encoding either Gal4-β-catenin or Gal4-VP16 together with the empty plasmid (control) or that expressing Aggf1. Data are relative to that observed in the empty vector-transfected cells that express Gal4-β-catenin or Gal4-VP16, as the mean±s.e.m. of three independent experiments. (C) Confocal images of caudal regions of 36hpf Tg(fli1:Gal4db-TΔC-2A-mC);(UAS:GFP);(fli1:Myr-mC) embryos injected without (control) or with aggf1-mCherry mRNA, as in Fig. 1B. (D) Fluorescence intensity of GFP in the CVP, as observed in C, relative to that observed in control embryos. Data are mean±s.e.m. Control, n=9; aggf1-mCherry mRNA, n=8. (E) Confocal images of caudal regions of 36hpf Tg(fli1:Gal4db-TΔC-2A-mC);(UAS:GFP);(fli1:Myr-mC) embryos injected with control MO or aggf1 MO1, as in Fig. 1B. (F) Fluorescence intensity of GFP in the CVP, as observed in E, relative to that observed in control MO-injected embryos. Data are mean±s.e.m. Control MO, n=11; aggf1 MO1, n=12. (A,B,D,F) *P<0.05, **P<0.01, ***P<0.001; n.s., not significant. Scale bars: 50µm.