
|
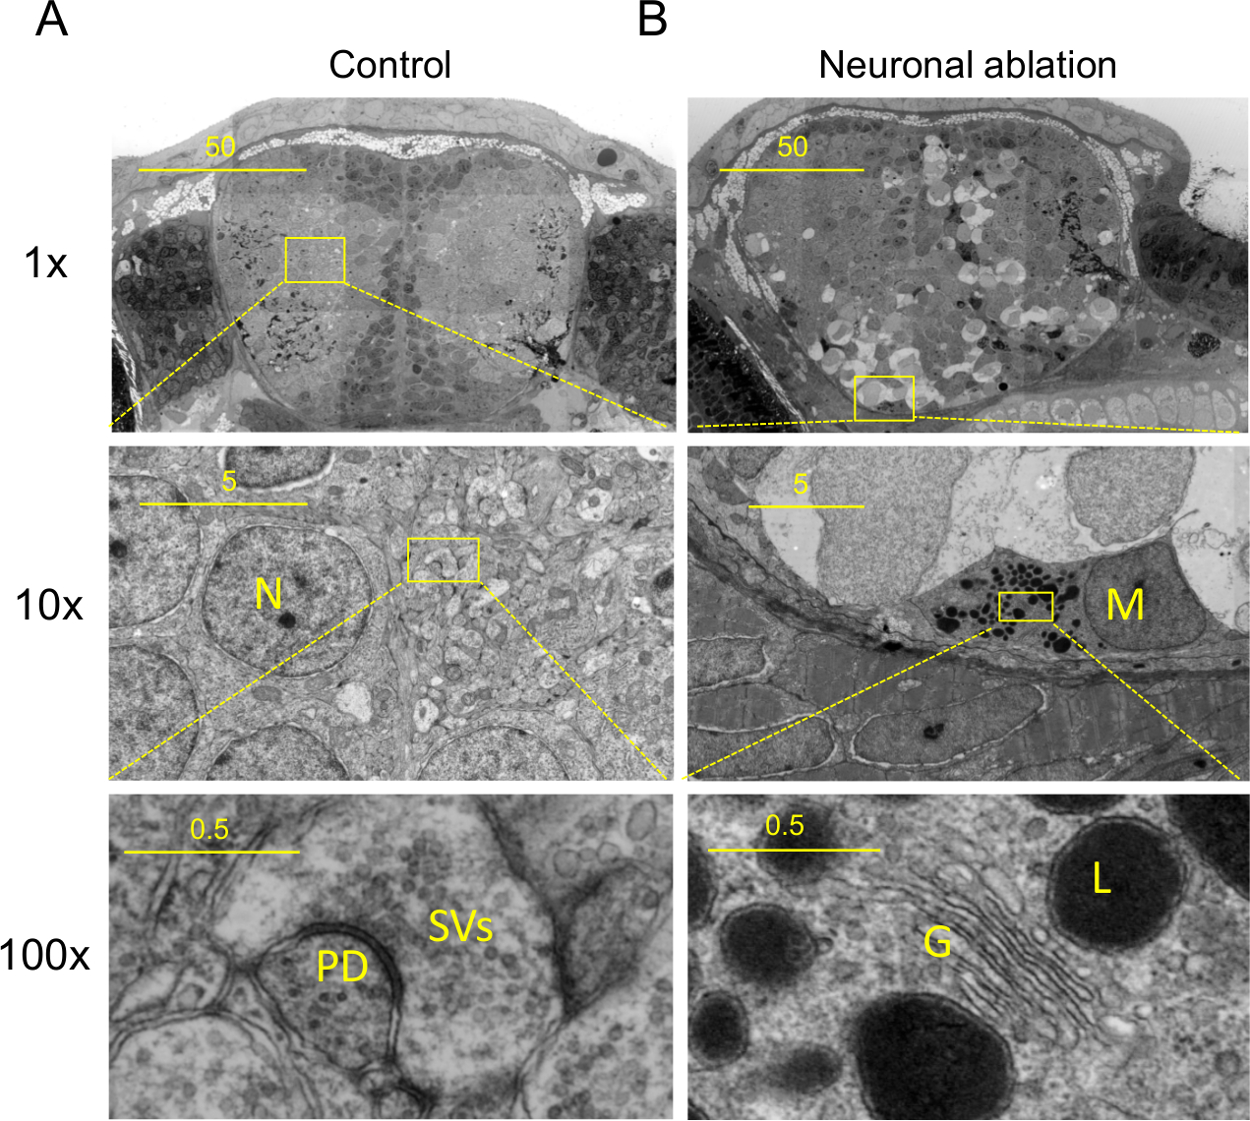
Fig. 2
Nanotomy Results: From Macromolecule to Tissue. (A) Nanotomy of brains of 7 days post fertilization control and (B) treated (neuronal ablation; Figure 1), showing features specific to the neuronal ablated degenerative brain. (B) These include phagocytic microglia, dark cells undergoing cell death and spongy appearance of neural tissue ((A) and (B)). Upper panels (adapted from5 ): 10X magnified view of region indicated in middle panels. Middle panels: 10X magnified view of region indicated in lower panels. (A, middle panel) High magnification view of neuropil showing synapse in (A, lower panel), synaptic vesicles (SVs) and postsynaptic density (PD). (B, Middle panel) High magnification view of amoeboid microglia or possibly a macrophage (middle panel, M) showing typical amoeboid microglial features (lower panel) including prominent Golgi apparatus (G), inclusions including lysosomal vacuoles (L). Scale bars: 50 µm (top), 5 µm (middle) and 0.5 µm (bottom).