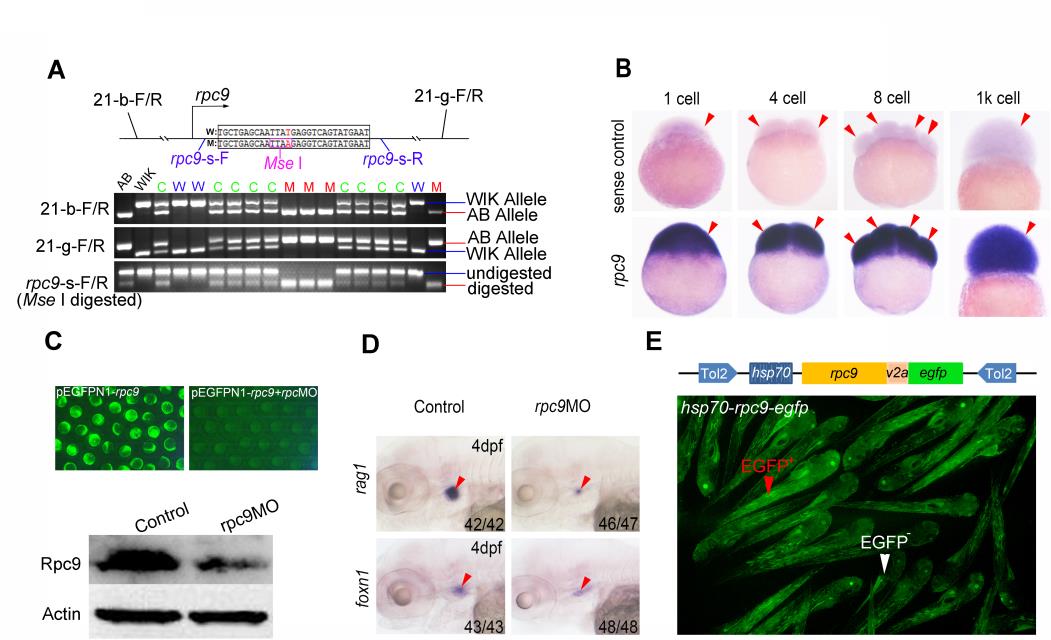
Fig. S1
The positional cloning result and the validation of candidate gene for 116 mutants. (A)A schematic of the mutated region was drawn and the newly generated restriction enzyme recognition site (MseI) was encircled with a purple box. Polymorphic primers (21-B-F/R and 21-G-F/R) and primers for rpc9 gene (rpc9-s-F/R, embracing Mse I) that used for genotyping were marked at their corresponding locations (Upper panel).The PCR results of 116 mutants screen with 21-B-F/R and 21-G-F/R, or with rpc9-s-F/R and then digested with Mse I (Lower panel). Note that the chromosomal locations and sequences of these primers are listed in Table S.3. AB represents AB strain (116 mutant carrier) grandparent and WIK represents WIK strain grandparent (wild-type). W, wild-type.M, mutant.C, mutant carrier. (B)WISH result demonstrated the maternal expression pattern of rpc9. Arrowheads mark the cell of zebrafish embryos. (C)The validation of rpc9 MO. Compared to the embryos injected with pEGFPN1-rpc9,EGFP signal in embryos co-injected with pEGFPN1-rpc9 and rpc9 MO was dramatically blocked(upper panel). Western blot showed that the protein level of Rpc9 in rpc9 morphants was remarkably lower than that of the control (lower panel). (D)The expression pattern of rag1 and foxn1 in rpc9 morphants. Red arrowheads mark the thymus.(E)rpc9 overexpression plasmid that driven by hsp70 promoter (hsp70-rpc9-egfp)and embryos injected with this plasmid showed effective EGFP expression after heat-shock. Red arrowhead marks GFPhigh embryos while white arrowhead marks GFPlow embryo.

