Fig. 4
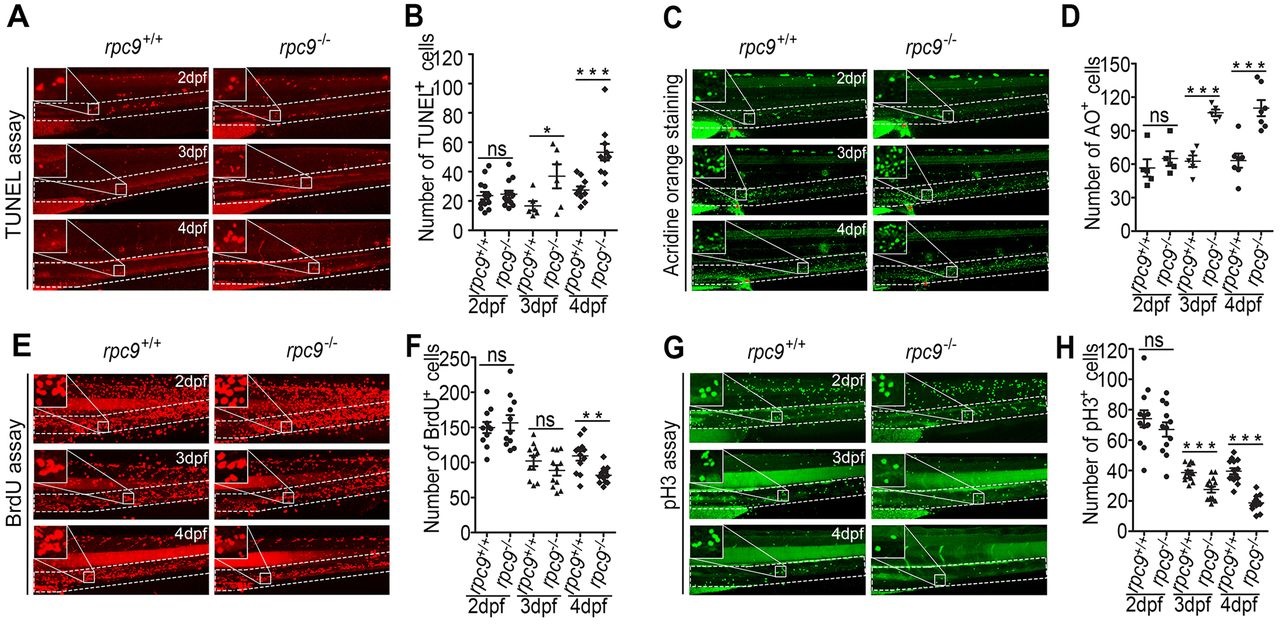
Enhanced apoptosis and reduced proliferation in the CHT of rpc9-/- mutants. (A,B) TUNEL assay shows apoptosis signals in the CHT region of rpc9+/+ and rpc9-/- embryos. TUNEL signals are significantly enhanced in rpc9-/- embryos at 3 and 4dpf, but not at 2dpf. (C,D) Acridine Orange (AO) staining shows that rpc9-/- embryos display more intensive apoptosis signals in the CHT region than rpc9+/+ embryos at 3 and 4dpf. Note that asterisk indicates the cloaca where unspecific spots were not taken into account when quantifying the apoptosis signals. (E,F) BrdU assay reveals that proliferation is affected in rpc9-/- embryos at 4dpf compared with rpc9+/+ embryos. (G,H) pH3 assay demonstrates the pH3 proliferation signals are significantly reduced in rpc9-/- embryos at 3 and 4dpf compared with rpc9+/+ embryos. Note that white dashed boxes in A,C,E and G enclose the CHT region where the signal spots (indicated by white arrowheads) were counted. A 3× magnified image is shown in the top left corner of each panel. Values are mean±s.e.m.; *P<0.05, **P<0.01, ***P<0.001, Student′s t-test. ns, not significant.

