
|
Fig. S2
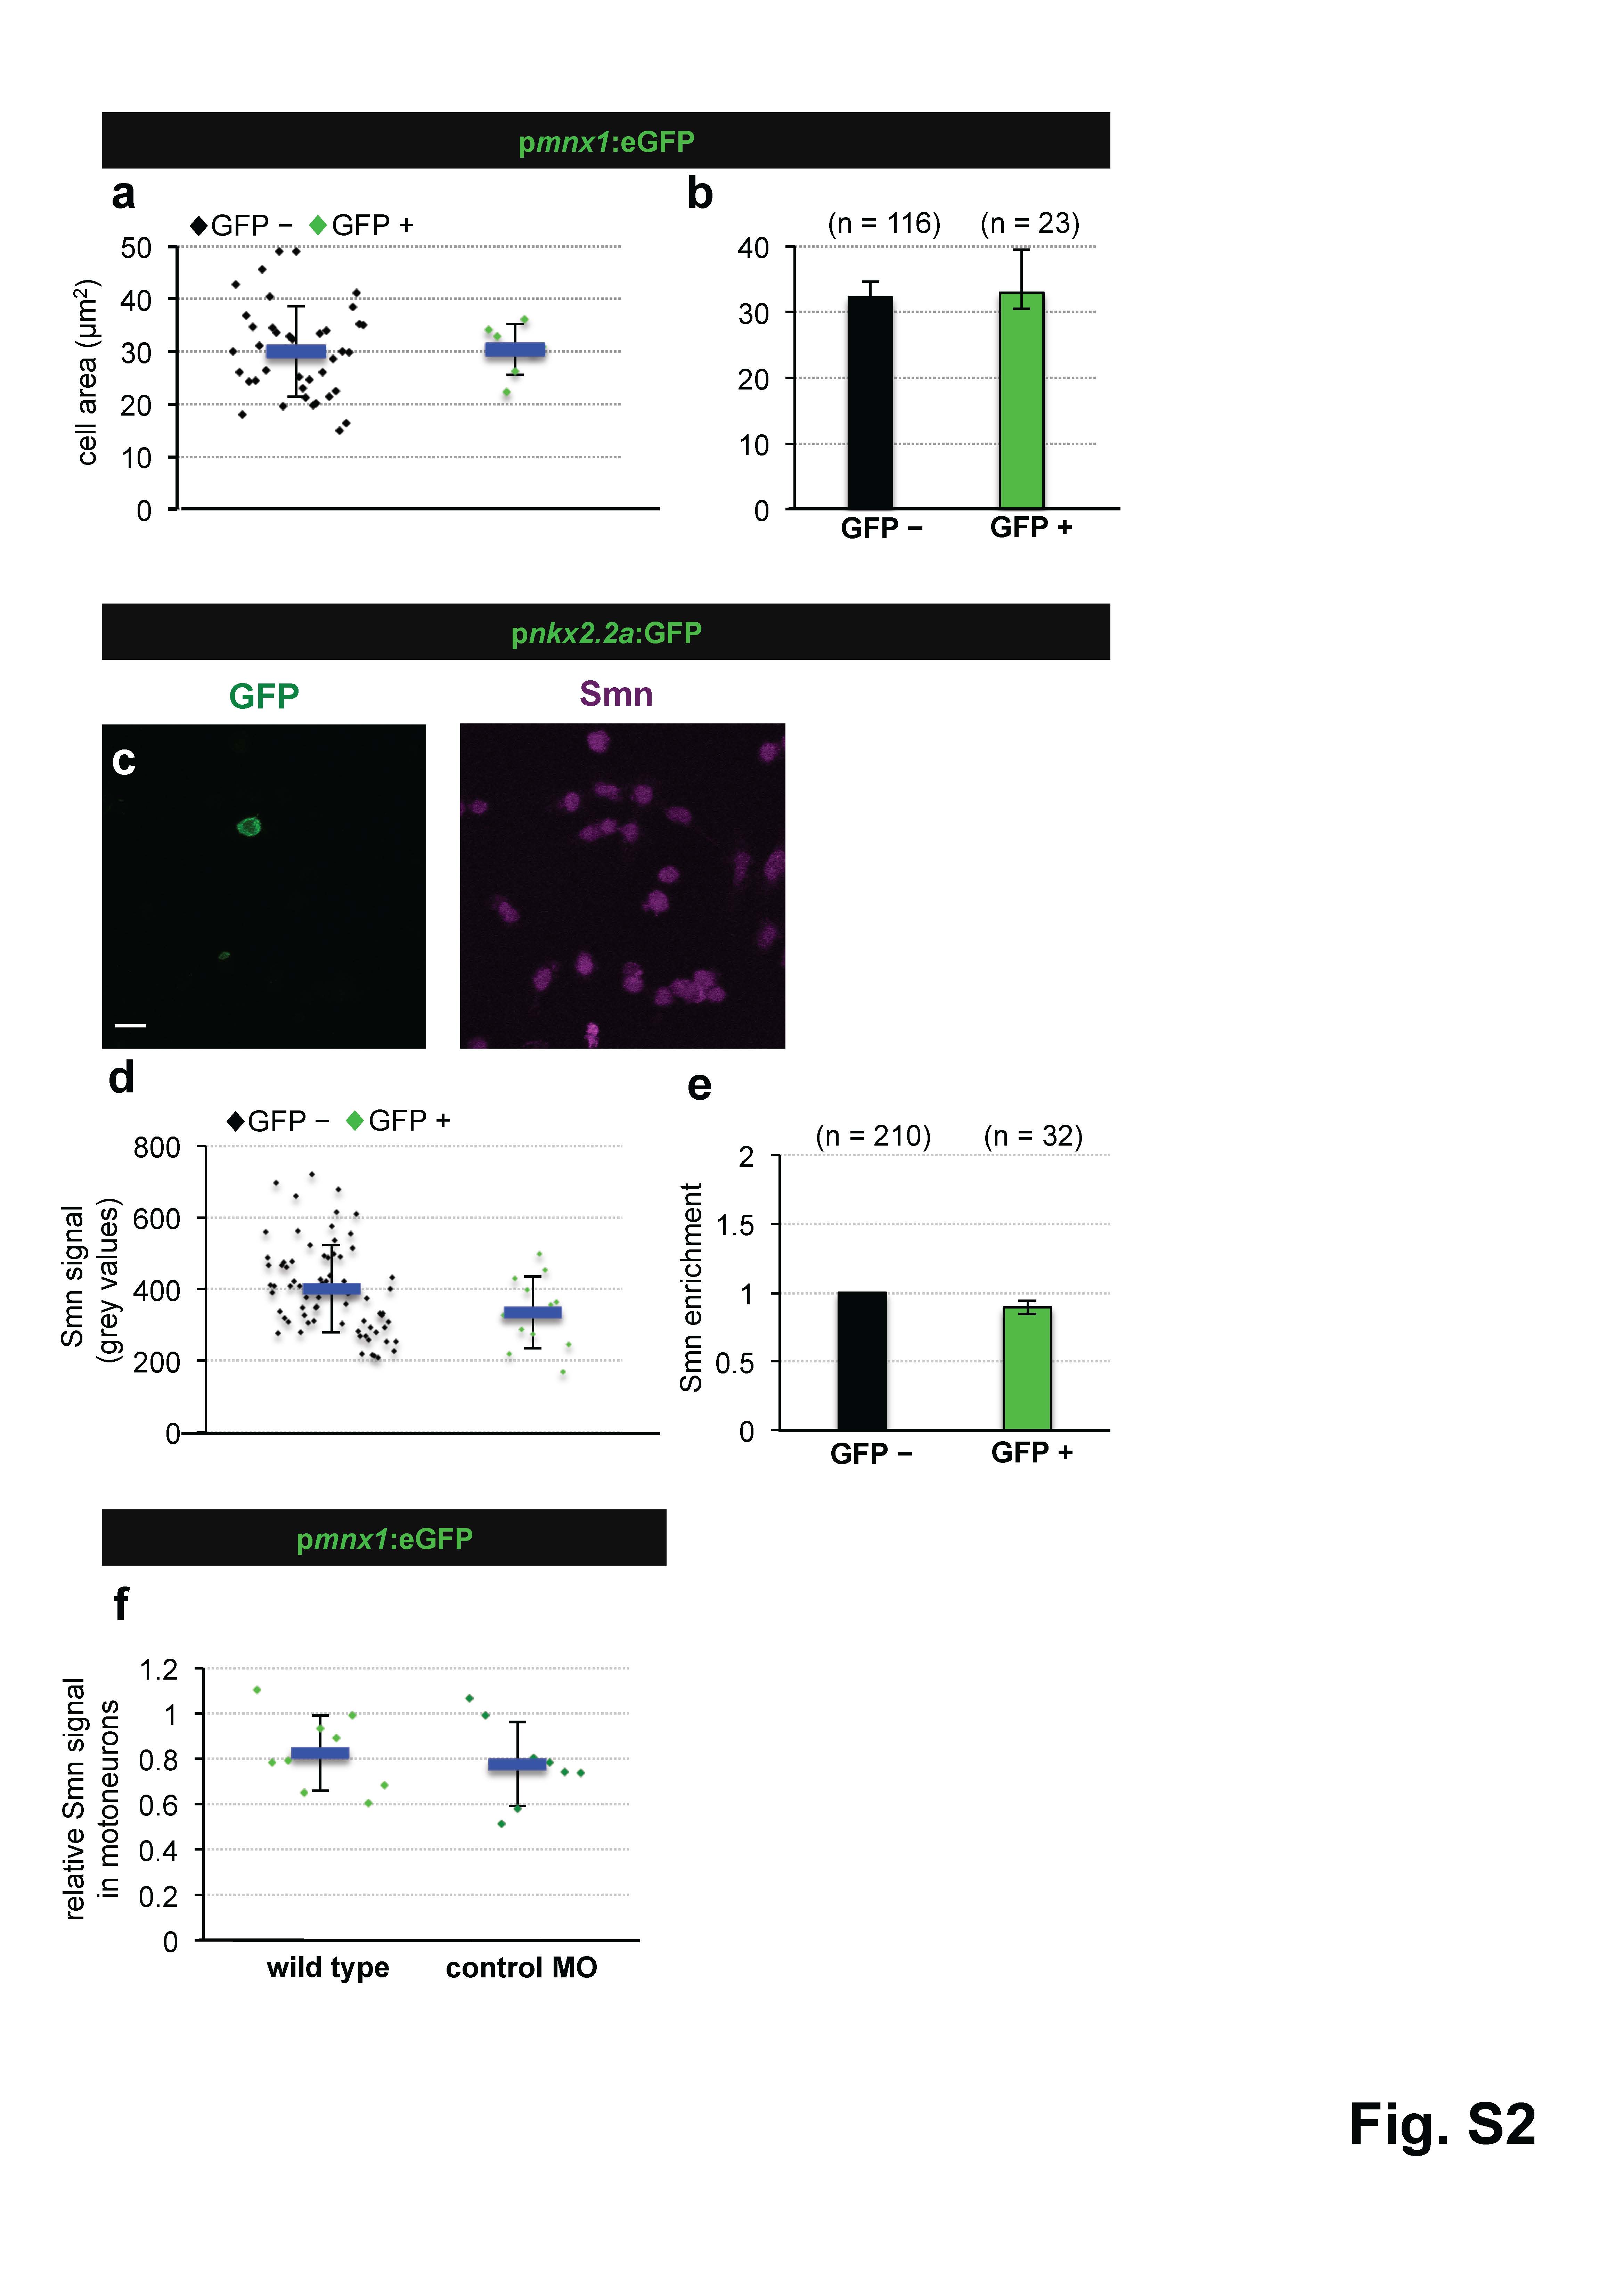
Smn levels are not higher in motoneurons due to a difference in cell size, are not elevated in perineurium cells and are not altered in motoneurons following control MO injection.
a Cell area measurement in GFP negative (black diamonds) and GFP positive (green diamonds) cells of pmnx1:eGFP embryos from a representative experiment. The exact values are (mean ± SD): 30.4 µm2 ± 4.8 (GFP -) and 30.1µm2 ± 8.7 (GFP +), p = 0.48 with Wilcoxon Sum Rank Test.
b Average cell size of GFP negative (black) and GFP positive (green) cells. N = 3 experiments. n = number of analyzed cells. Exact values are (mean ± SD): 32.3 µm2 ± 2.5 (GFP -) and 33 µm2 ± 6.5 (GFP +).
c scIF on pnkx2.2a:GFP embryos. GFP and Smn signals are shown in Z-projected confocal sections.
d Quantification of absolute Smn signal from a representative experiment. Exact values are (mean ± SD): 400 ± 122 (GFP -) and 335 ± 100 (GFP +), p=0.06 with Wilcoxon Sum Rank Test.
e Ratio of Smn levels in perineurial cells (green) versus control cells (black). N = 3 experiments. n = number of analyzed cells. The exact value is (mean ± SD): 0.89 ± 0.05.
f Quantification of scIF performed on pmnx1:eGFP embryos in wild type and in control MO cells. Exact values are (mean ± SD): 0.83 ± 0.17 (GFP -) and 0.78 ± 0.19 (GFP +), p=0.46 with Wilcoxon Sum Rank Test.