
|
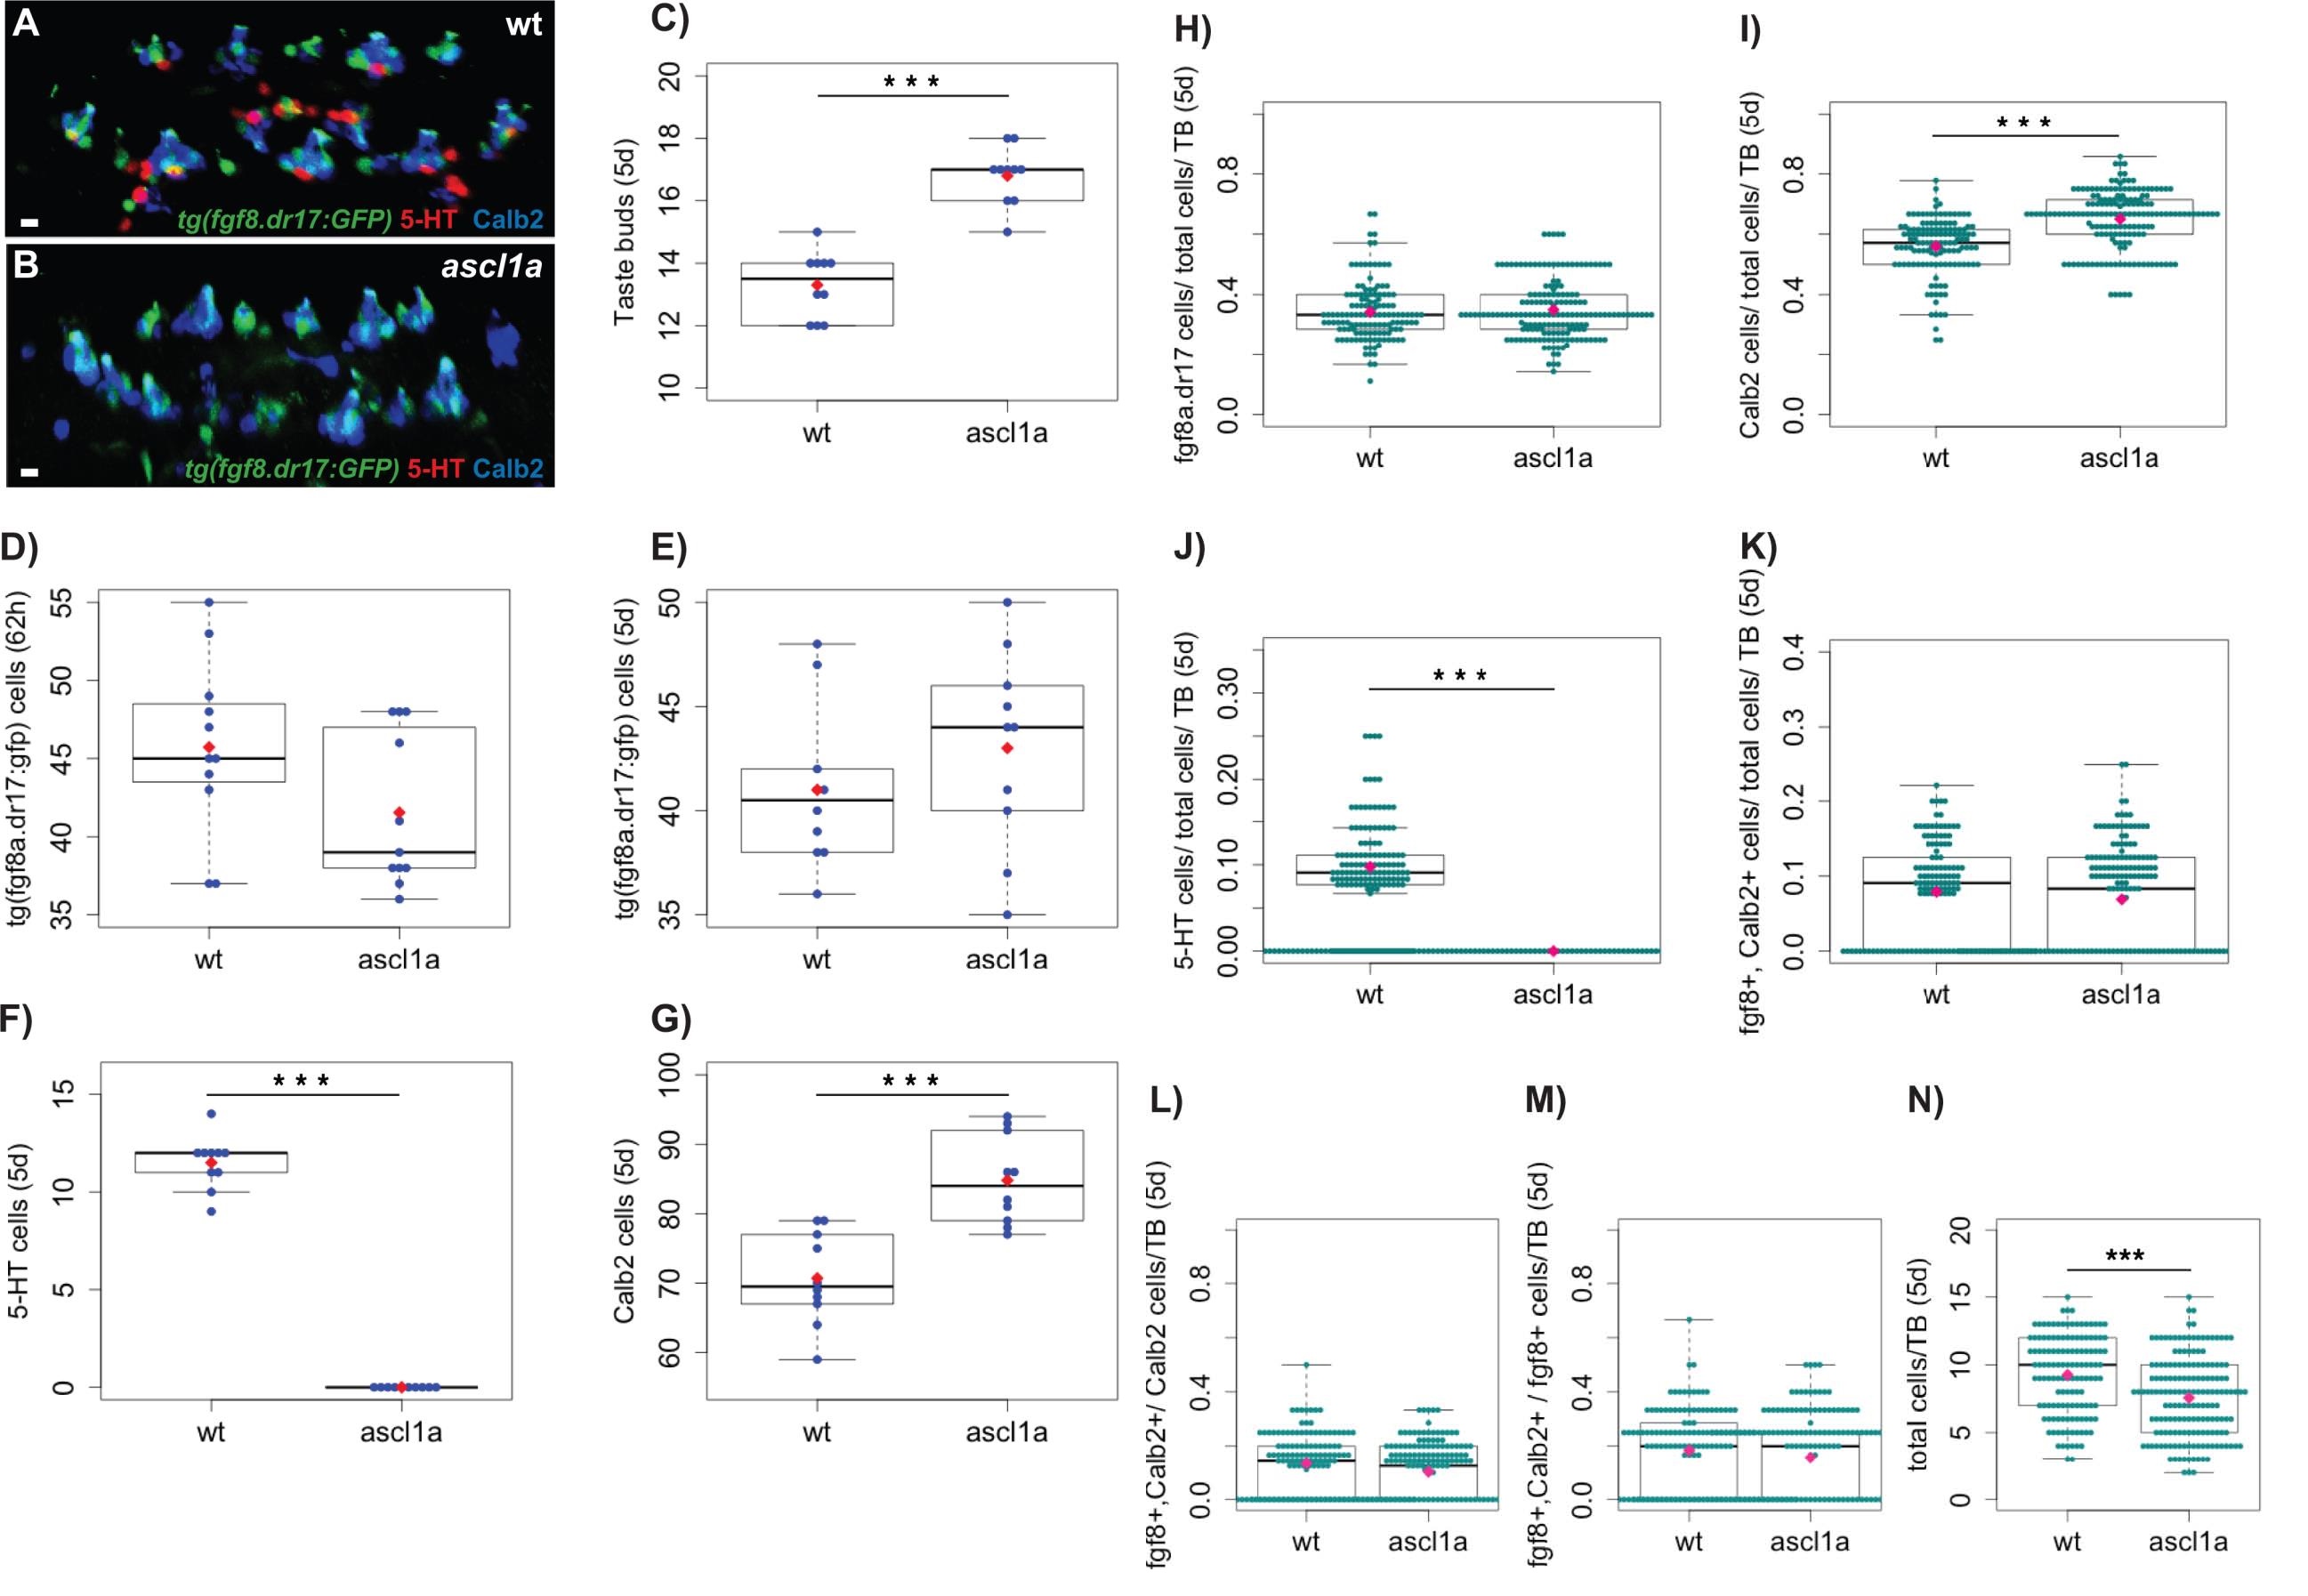
Fig. S4
Comparison of taste buds (A-B), their number (C), total number of cells of each type (D-G) and ratios of cells (per cell type and per taste bud, H-M) in wild-type and ascl1a-/- larvae mouth lips. The phenotype of taste buds and general larval morphology is indistinguishable between wild-type and heterozygous ascl1a+/- larvae and therefore, these data were grouped as ‘wild-type’. Data from 10 wild-type (wt: grouped 6 wild-type and 4 wild-type siblings from heterozygous ascl1a+/- crosses, n=133 taste buds) and 10 ascl1a-/- larvae (n=169 taste buds, 5dpf, fixed tissue), except D (n=11, ‘wild-type’= 6 wild-type and 5 wild-type siblings from heterozygous ascl1a+/- crosses, 62hpf, fixed tissue). In the boxplots, black lines show median values and red spots, mean values. A,B confocal projections showing the taste buds of the mouth lips of a wild-type and an ascl1a-/- larva. ascl1a-/- larvae were devoid of 5-HT cells (B,F,J), had non significant difference in the number of tg(fgf8a.dr17:gfp) expressing cells (D,E,H) but had increased number of taste buds (C) and Calb2 (Type II) expressing cells (G,I) compared to the wild-type. K shows the ratio of cells per taste bud that coexpress tg(fgf8a.dr17:gfp) and Calb2. L shows the ratio of Calb2/Type II cells that co-express tg(fgf8a.dr17:gfp) within a taste bud. M shows the ratio of tg(fgf8a.dr17:gfp) cells that co-express Calb2/Type II cells within a taste bud. 5-HT cells co-expressing tg(fgf8a.dr17:gfp) at 5dpf were rare (n=7/115 cells 5-HT cells). N: The number of total cells varies from one developing taste bud to another at 5dpf. A significant difference was found between the distributions of the total number of cells per taste bud between wild-type and ascl1a mouth lips. Statistical tests: C: Welch two-sample t-test : t = -8.2832, df = 17.384, p-value = 1.923e-07. D: Two-sample Kolmogorov- Smirnov : D = 0.4545, p-value = 0.2058. E: Welch two-sample t-test : t = -1.4604, df = 16.982, p-value = 0.1624. F: Welch two-sample t-test : t = 26.8582, df = 9, p-value = 6.655e-10. G: Welch two-sample t-test : t = - 4.8152, df = 17.968, p-value = 0.0001394. H: Two-sample Kolmogorov-Smirnov : D = 0.0799, p-value = 0.7283. I: Two-sample Kolmogorov-Smirnov : D = 0.4844, p-value = 1.332e-15. J: Two-sample Kolmogorov- Smirnov : D = 0.8647, p-value < 2.2e-16. K: Two-sample Kolmogorov-Smirnov : D = 0.1216, p-value = 0.2211. L: Two-sample Kolmogorov-Smirnov : D = 0.1282, p-value = 0.1732. M: Two-sample Kolmogorov-Smirnov : D = 0.1098, p-value = 0.3313 N: Two-sample Kolmogorov-Smirnov : D = 0.2529, p-value = 0.0001469.