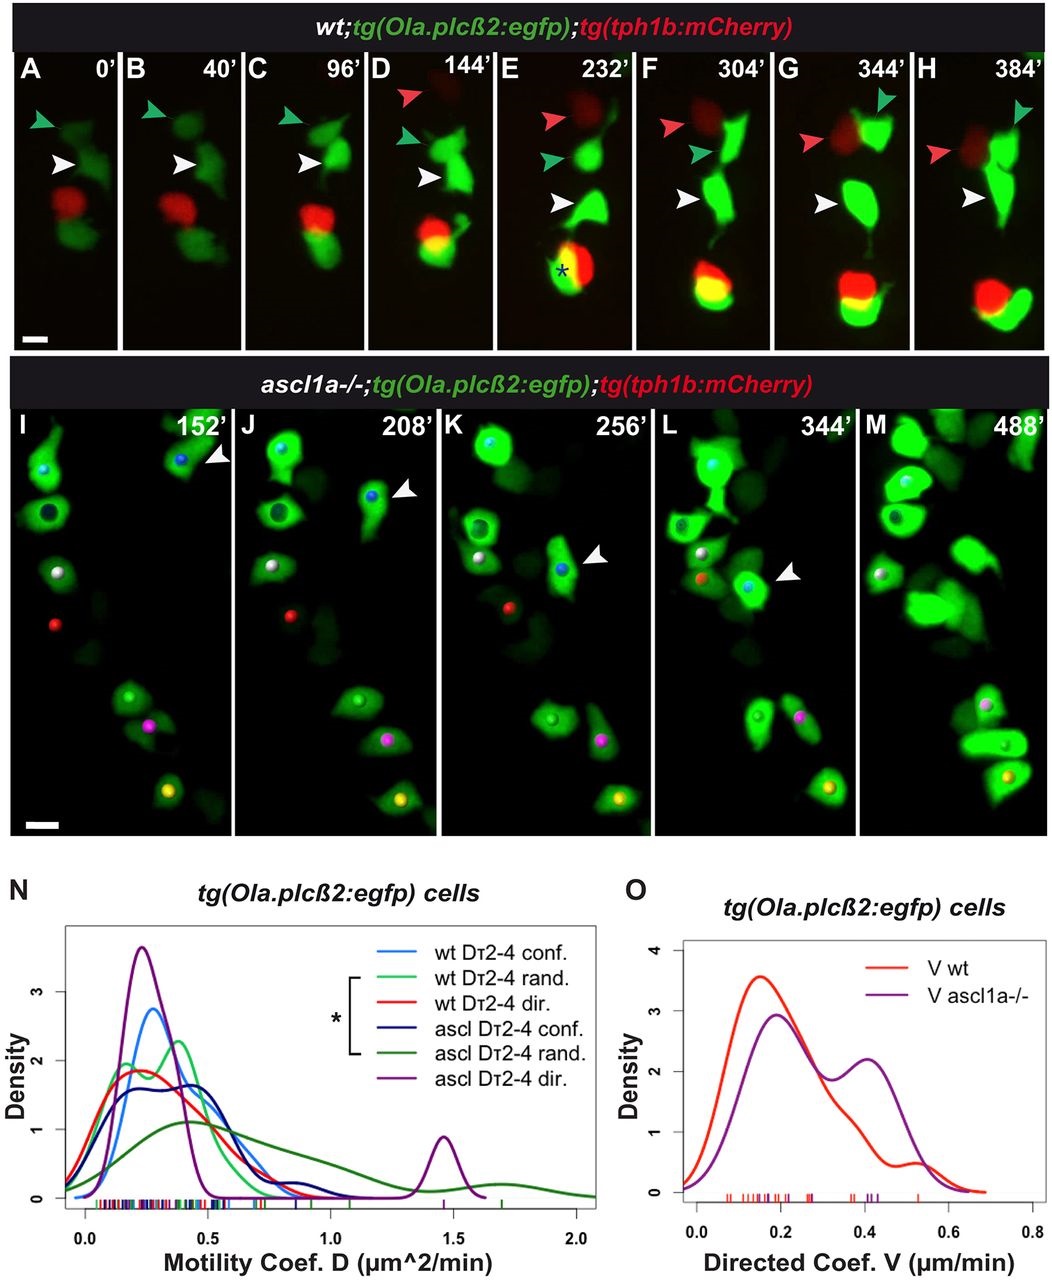
Fig. 6
tg(Ola.plcβ2:egfp) cells are displaced in three modes in the wild-type and ascl1a-/- mouth. (A-H,I-M) Snapshots of Movies 9 and 10, respectively. Both films started at approximately 64hpf. Additional data is shown in Table 1, Tables S1, S2, Fig. S2E-H, Appendix S1. (A-H) tg(Ola.plcβ2:egfp) cells formed in proximity to tg(tph1b:mCherry) cells (red, red arrowhead), they were displaced among them (white, green arrowheads) and joined them. In E, asterisk shows overlap of two cells on z-axis. (I-M) ascl1a-/-;tg(Ola.plcβ2:egfp) cells form groups (yellow, pink, green dots at the bottom of the frame). White arrowhead indicates a cell that joined the cell indicated with a red dot in directed mode (Appendix S1). (N-O) Kernel plots of motility Dτ2-τ4 coefficients of tg(Ola.plcβ2:egfp) cells. In contrast to tg(fgf8a.dr17:gfp) cells, tg(Ola.plcβ2:egfp) cells show directed motility in ascl1a-/- mouth (compare with Fig. 3 T-V). The significant difference between wild-type and ascl1a-/- relative random motility Dτ2-τ4 coefficients are highlighted with an asterisk (light and dark green; KS test, *P<0.05). Detailed statistics for all motility coefficients are provided in Tables S1, S2, Fig. S2. Scale bars: 10µm.

