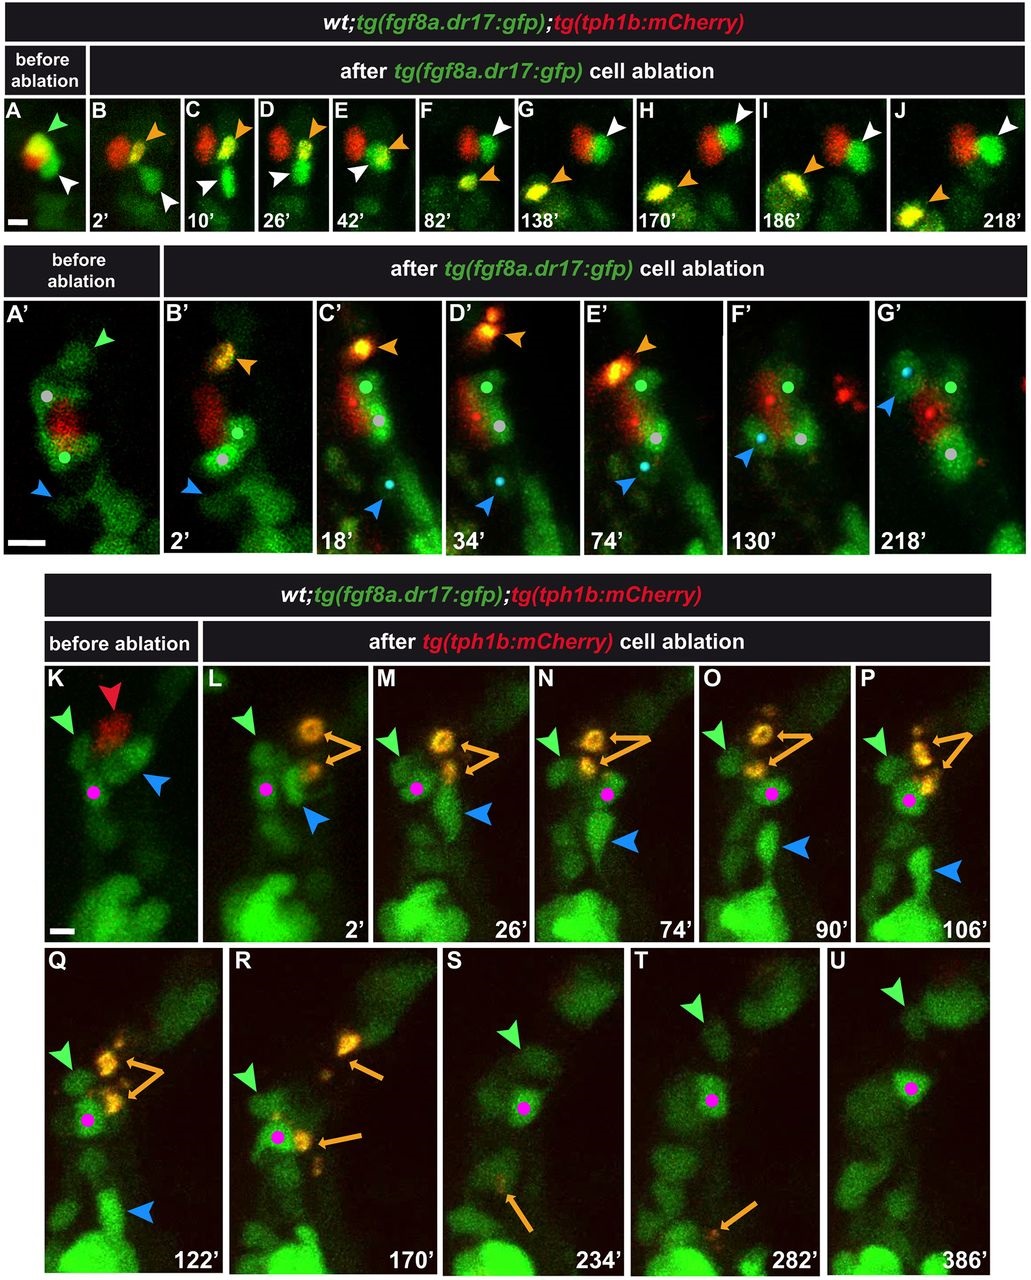
Fig. 5
Consequences of tg(fgf8a.dr17:gfp) or tg(tph1b:mCherry) cell ablation in taste bud formation. Anterior-lateral mouth, multi-photon z-stack image projections. The green (A,A2) and red (K) arrowheads indicate tg(fgf8a.dr17:gfp) and tg(tph1b:mCherry) cells that were ablated. (C-J,C′-G′,M-U) Snapshots of Movies 4-6, respectively. Time (min) after multi-photon laser ablation is shown. Statistics are in Fig. S3. Orange arrowheads (B-J,B′-E′) and arrows (L-T) indicate remaining fragments (yellow/orange) of ablated cells. In E, the remaining fragment overlaps with the neighboring tg(fgf8a.dr17:gfp) cell (z-projection). In A-J, white arrowhead indicates the tg(fgf8a.dr17:gfp) cell displaced away from (B-D) but re-established contact with (E-J) the tg(tph1b:mCherry) cell after ablation of the neighboring tg(fgf8a.dr17:gfp) cell. In A′-G′, white and green dots mark the position of intact tg(fgf8a.dr17:gfp) cells that maintained contact with the tg(tph1b:mCherry) cell after ablation of the neighboring tg(fgf8a.dr17:gfp) cell (orange arrowhead). Blue arrowhead/dot marks a tg(fgf8a.dr17:gfp) cell that joined the taste bud. In K-U, the three cells next to the tg(tph1b:mCherry)-ablated cell (orange arrows) are marked. Blue and green arrowheads mark cells that quitted the ablation site towards other taste buds. The pink dot marks a cell that remained in proximity to the ablation site and formed a group with tg(fgf8a.dr17:gfp) (low expression) cells that were not part of the targeted taste bud (see also Movie 6). Scale bars: 10µm.

