
|
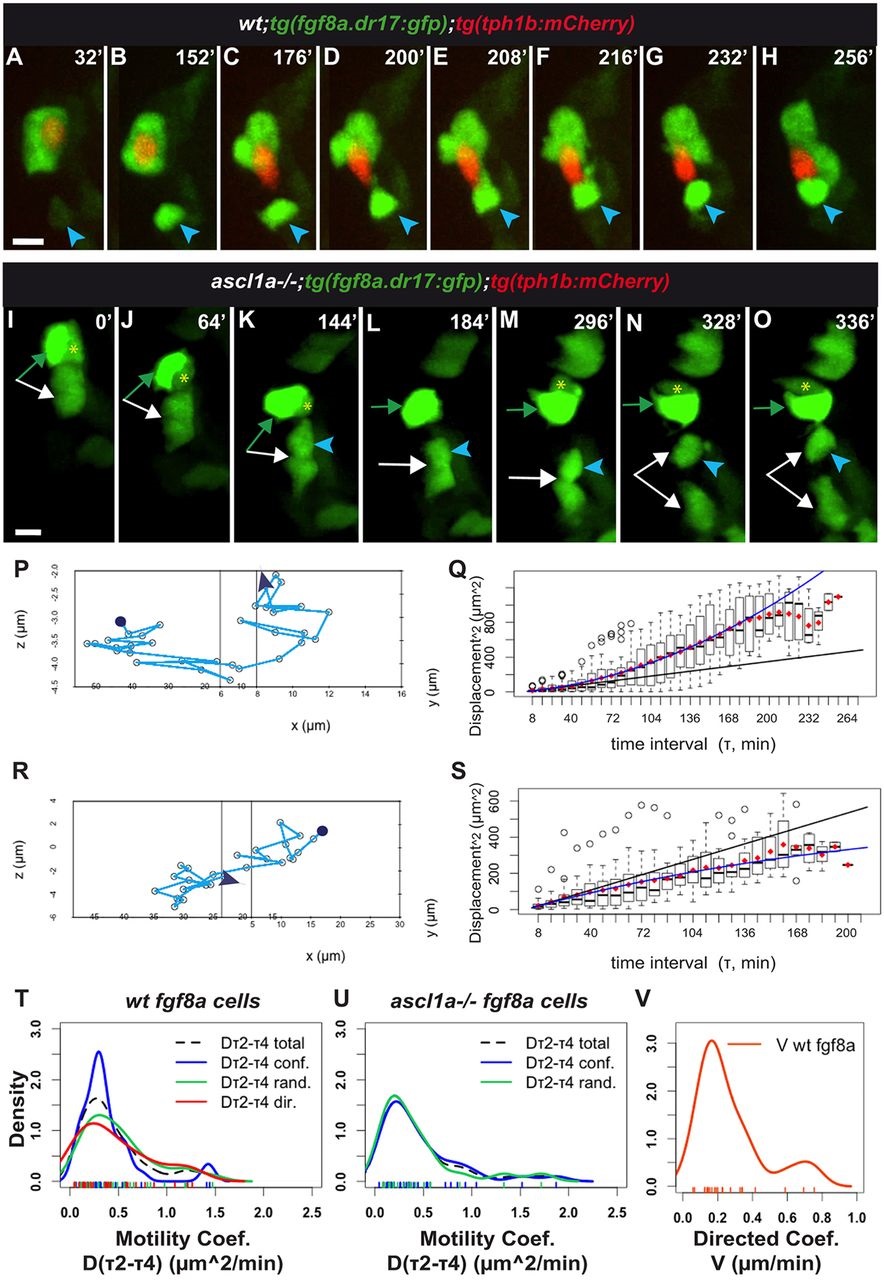
Fig. 3
tg(fgf8a.dr17:gfp) cell displacement during taste bud formation: differences between wild-type and ascl1a-/- larvae. In all figures with movie snapshots unless otherwise mentioned: spinning-disk z-stack image projections; time (minutes, top right) counts from time-lapse beginning. Anterior-medial mouth in live larvae. (A-H,I-O) Snapshots from Movies 1 and 7, respectively, started at approximately 60hpf. (A-H) Wild-type. (I-O) ascl1a-/- mouth devoid of tg(tph1b:mCherry) expression. For detailed statistics, see Table 1, Fig. S2A-D, Tables S1,S2. Additional data in Appendix S1. tg(fgf8a.dr17:gfp) (green) cells form taste buds with (A-H) or without (I-O) tg(tph1b:mCherry) (red) expressing cells. In A-H, blue arrowhead indicates an epithelial tg(fgf8a.dr17:gfp) cell that joins the organ. In I-O, the arrows, arrowhead and asterisk indicate cells that initially formed an organ (green arrow- and yellow asterisk-marked cells overlap on z-axis in L). This organ splits over time and cells can remain together or become separate and regroup. (P,R) Tracks of relative displacement while individual cells (blue arrowheads in A-H,K-O, respectively) joined taste buds. Reference cell: in P, the tg(tph1b:mCherry) shown in A-H, time period 0-256min; in R, the tg(fgf8a.dr17:gfp) cell indicated by green arrow in I-O, time period 136-336 min. See additional data in Movie 1, blue dot; Movie 7, red dot; Appendix S1. (Q,S) MSD(τ) plots corresponding to tracks in P,R, respectively. Each boxplot shows all square displacement values for corresponding time intervals (each time interval 8min, τ1=one interval, τ2=two intervals...); mean values shown by red diamonds. Black line is linear fit to τ2-τ4 mean values. Blue line is fit with the minimal summed-square of residuals; quadratic (Eqn. 6) in Q, showing directed motion; asymptotic (Eqn. 5) in S, tending towards a constant value B; confined displacement in a domain of size ~B. See Appendix S1. (T-V) Kernel (probability) density plots of coefficients for tg(fgf8a.dr17:gfp) cell motility. In T,U, motility coefficients Dτ2-τ4 come from similar continuous distributions in wild-type or ascl1a-/- larvae (see also Tables S1,S2, Fig. S2). In U,V, ascl1a-/-;tg(fgf8a.dr17:gfp) cells were devoid of directed motility [absence of ascl1a-/- Dτ2-τ4 and V, in U and V graphs, respectively]. Scale bars: 10µm.