
Image
|
Figure Caption
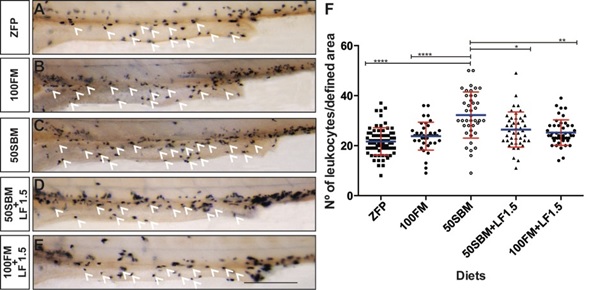
Fig. S1
Effect of lactoferrin on the amount of leukocytes present in the intestine. Sudan Black B staining was performed on 9dpf larvae, after four days of feeding with different diets (ZFP, 100FM, 50SBM, 50SBM+LF1.5, 100FM+LF1.5). (A-E) Lateral view of intestines, white arrowhead indicates leukocytes. (F) The experiments were conducted with at least 28 larvae per treatment in three different assays. Statistical analysis was performed by comparing data sets with the 50SBM diet through one-way ANOVA.The graph is a representation of three different results. *P < 0.05; **P < 0.01; ****P < 0.0001. Bar scale = 200 µm.
Acknowledgments
This image is the copyrighted work of the attributed author or publisher, and
ZFIN has permission only to display this image to its users.
Additional permissions should be obtained from the applicable author or publisher of the image.
Full text @ J Immunol Res