Fig. 2
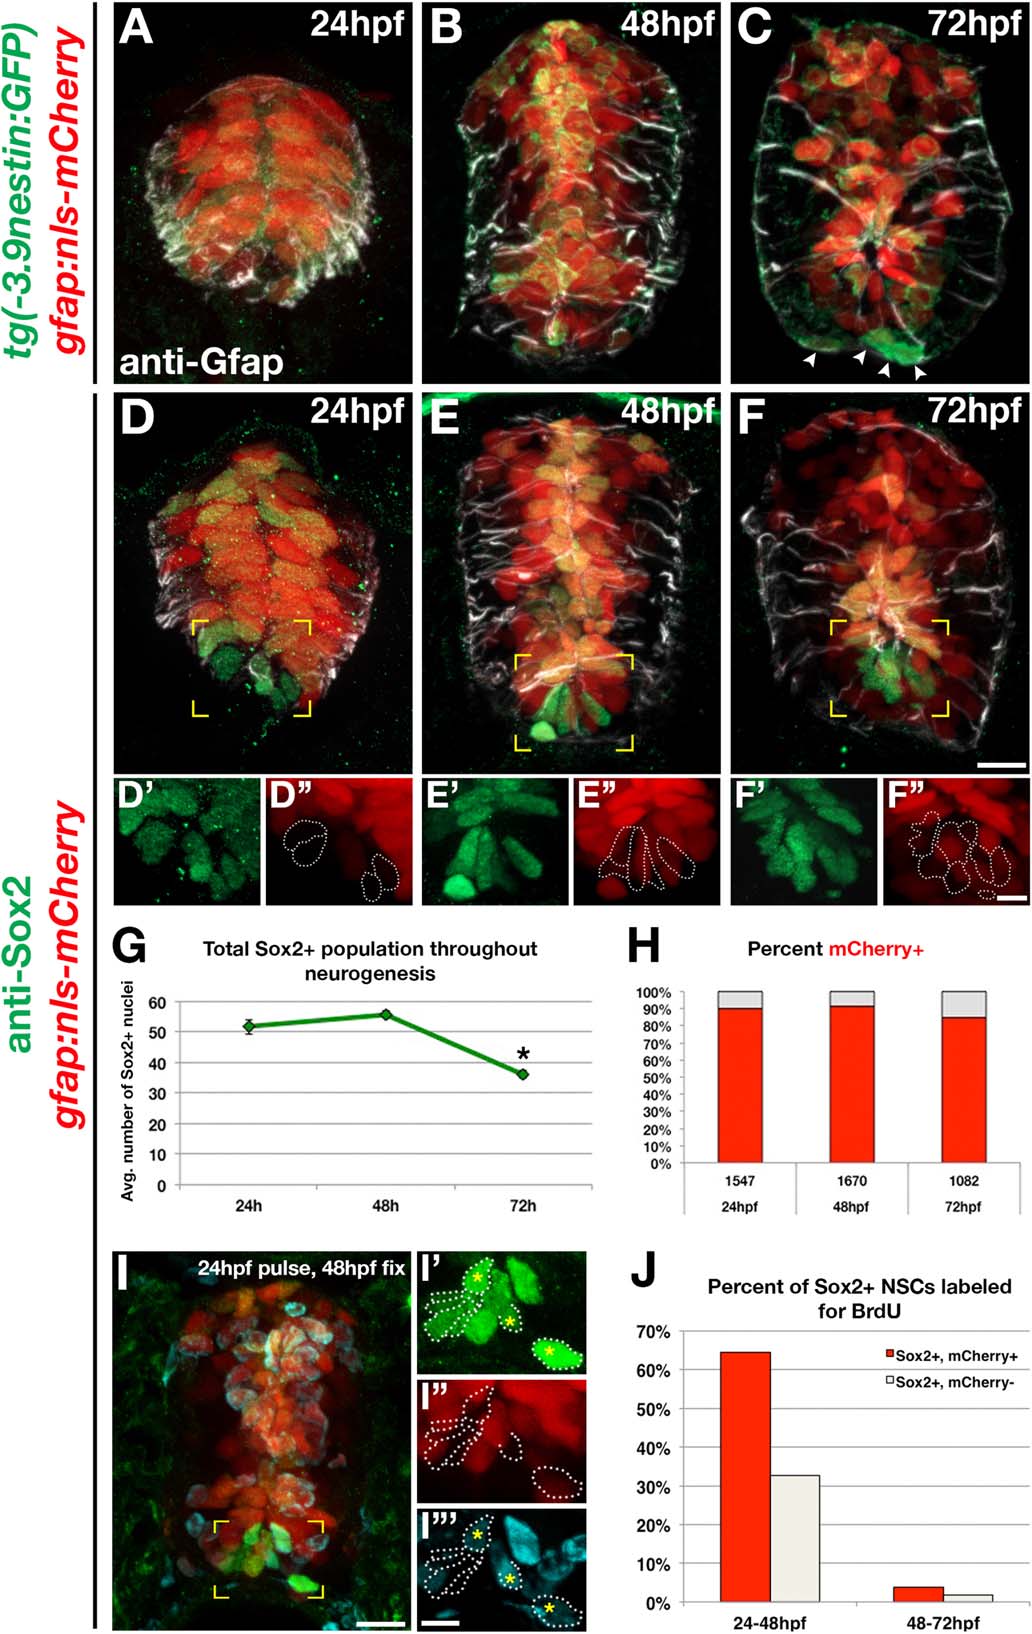
gfap+ radial glia coexpress neural stem markers. (A-C) Cross sections of 24, 48, and 72 hpf double transgenic gfap:nls-mCherry;-3.9nestin:GFP embryos labeled with anti-Gfap (white) and anti-GFP to visualize nestin+, gfap+ radial glial populations. (D-F) Cross sections of 24, 48, and 72 hpf gfap:nls-mCherry embryos immunolabeled with anti-Sox2 (green) and anti-Gfap (white). Scale bar = 10 µm. (D′-E3) Enlarged views of yellow-boxed areas comparing ventral Sox2+ nuclei in panels D′, E′, F′ with ventral nls-mCherry+ nuclei in panels D3, E3, F3. Sox2+, mCherry negative nuclei were outlined for clarity. Scale bar = 5 µm (G) Quantification of the total number of Sox2+ cells present at all time points. (H) Quantification of the percentage of total Sox2+ nuclei that are nls-mCherry+ (red) throughout neural development. Numbers above each population represent the total number of cells assayed per time point. (I) Cross section of a gfap:nls-mCherry embryo treated with BrdU at 24 hpf, fixed at 48 hpf, and labeled for anti-Sox2 (green) and anti-BrdU (cyan). Scale bar = 10µm. (I′-I3′) Enlarged view of yellow-boxed area in panel I, with ventral Sox2+, nls-mCherry negative cells outlined for clarity. Asterisks denote ventral Sox2+/nls-mCherry- cells that are BrdU+. Scale bar = 5µm. (J) Quantification of the percentage of Sox2+ populations positive for BrdU at all time points. Sox2+/nls-mCherry+ cells are shown in red, and Sox2+/nls-mCherry negative cells are depicted in white.

