
|
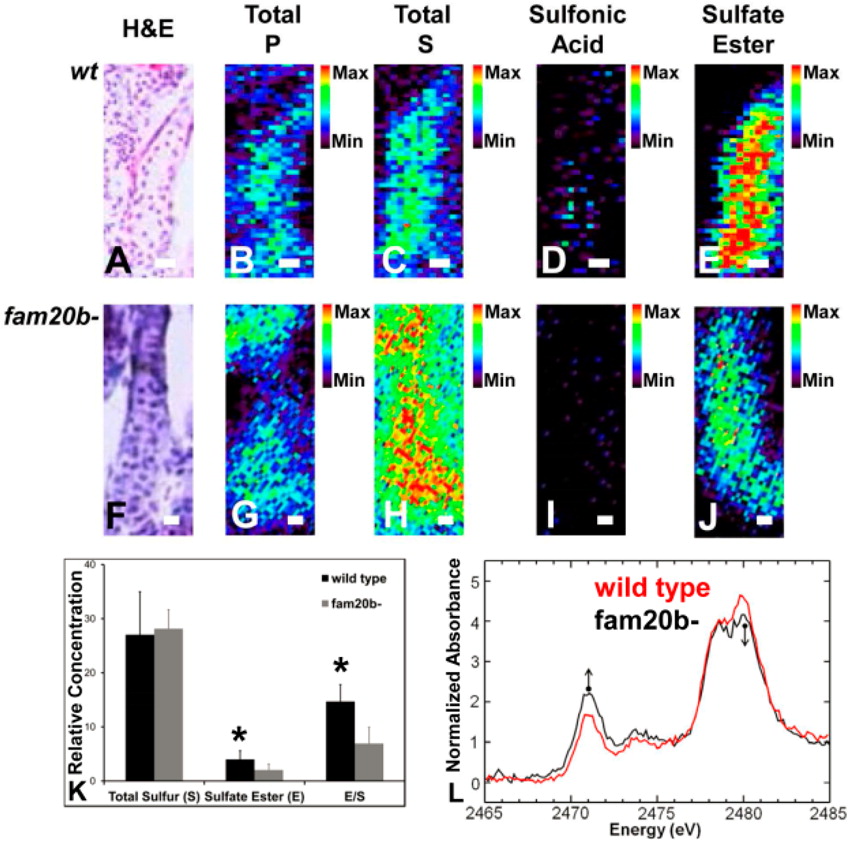
Fig. 7
Chemically specific sulfur imaging shows a significant difference in sulfate ester, but not total sulfur, content in mutant (fam20b-) cartilage compared with wild-type cartilage: (A-E) wild type and (F-J) fam20b- mutant. (A and F) H&E histology. (B and G) Total phosphorus. (C and H) Total sulfur. (D and I) Sulfonic acids. (E and J) O-linked sulfate-esters. The scale bar is 5 µm. (K) Quantification of total sulfur and sulfate esters in cartilage. A Student’s t test at the 95% confidence limit was used to test for significant differences between groups. *p < 0.05. The data are presented as relative concentration (fluorescence yield). (L) µ-XAS of wild-type vs fam20b- cartilage, suggesting that while levels of sulfate esters are lower in the mutant (right arrow), levels of thiols and/or disulfides are higher (left arrow).