
|
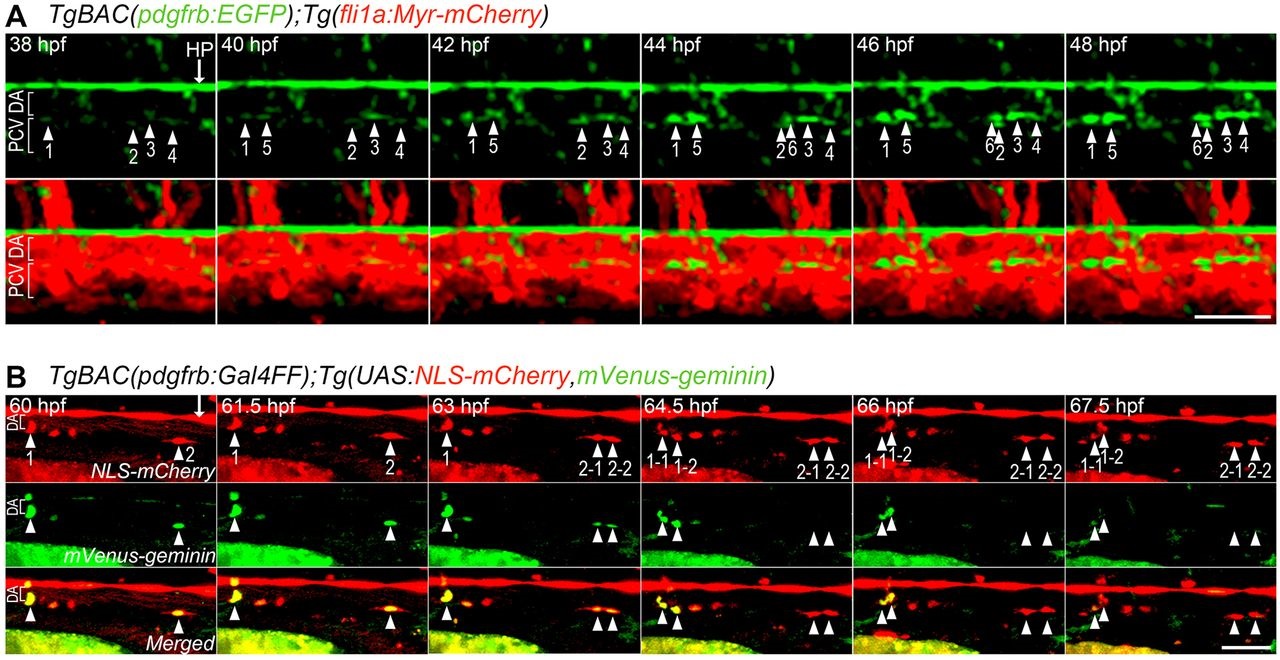
Fig. 4
Live imaging of MC coverage of axial vessels in the trunk. (A) Time-lapse confocal images of an axial vessel in the trunk of TgBAC(pdgfrb:EGFP);Tg(fli1a:Myr-mCherry) embryos (38-48hpf). Upper, pdgfrb:EGFP; lower, merged images of pdgfrb:EGFP (green) and fli1a:Myr-mCherry (red). Arrowheads with numbers indicate individual EGFP-positive cells emerging at the ventral part of the DA. Arrow indicates hypochord (HP). (B) Time-lapse confocal images of a trunk axial vessel in TgBAC(pdgfrb:Gal4FF);Tg(UAS:NLS-mCherry,mVenus-geminin) embryo (60-67.5hpf). Top, NLS-mCherry (red); middle, mVenus-geminin (the cells in the S/G2/M phase of the cell cycle) (green); bottom, merged images. Arrowheads with numbers indicate individual mCherry/mVenus double-positive cells located in the ventral part of DA. Note that mCherry/mVenus double-positive cells (1 and 2) divided into two daughter cells (1-1/1-2 and 2-1/2-2), which subsequently lost mVenus fluorescence. Arrow indicates hypochord. Lateral view, anterior to the left. Scale bars: 50µm.