
|
Fig. S2
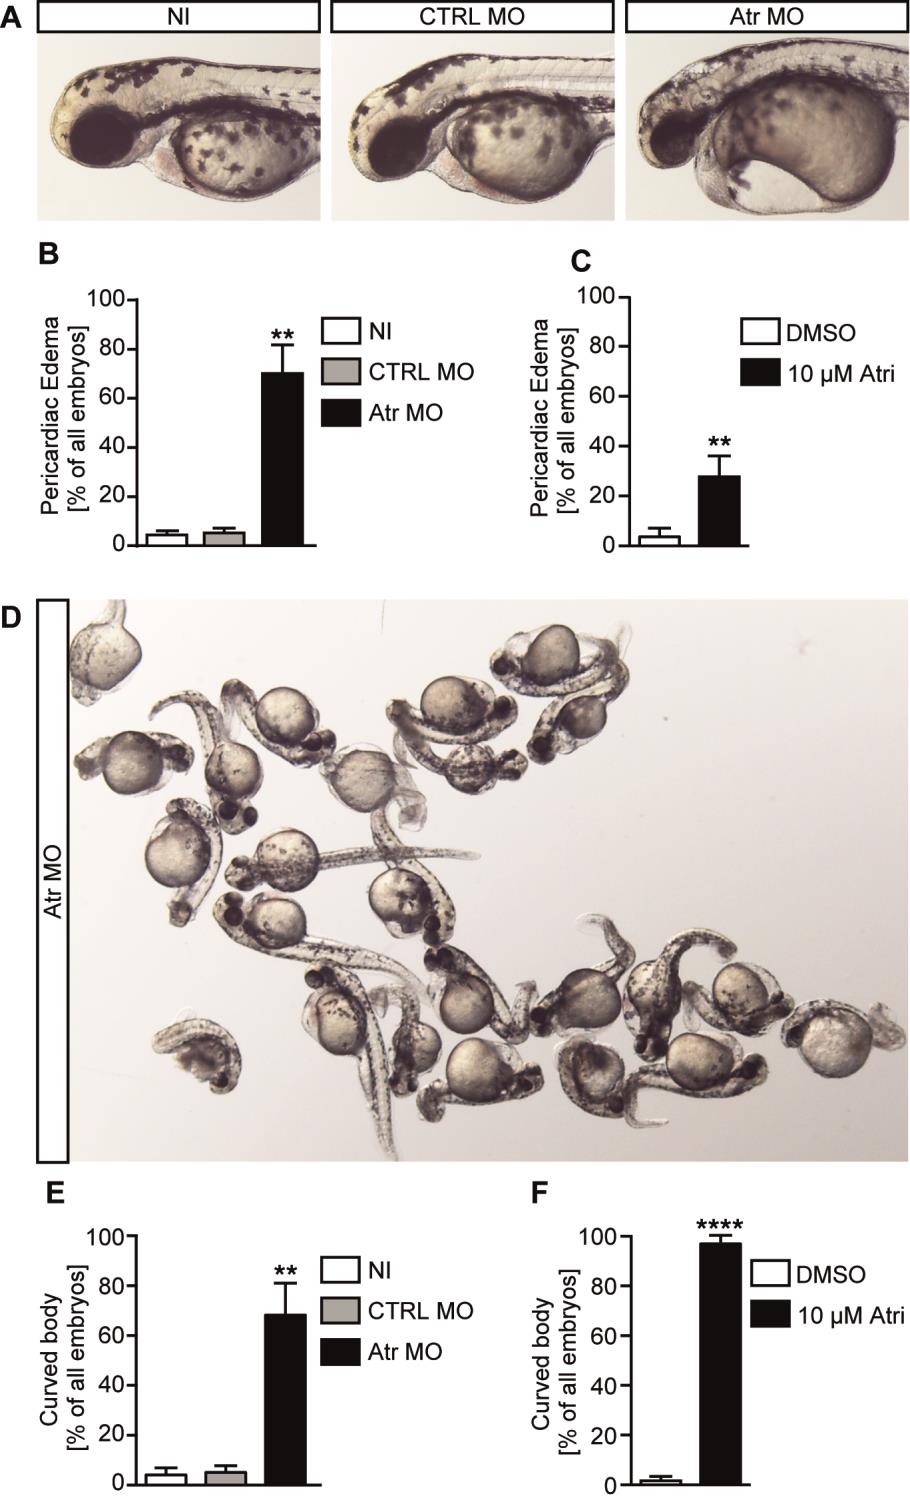
Atr morphant zebrafish display morphological phenotypes typical of cilia dysfunction.
A) Live images of 48 hpf zebrafish embryos showing pericardiac edema upon Atr knockdown. Zebrafish were either left uninjected (NI) or control injected with a standard control MO (CTRL MO) or the translation blocking Atr MO.
B) Percentage of embryos developing pericardiac edema. Graph displays mean values ± SEM, n=79-85 embryos in 3 experiments. ** indicates p<0.01, One way ANOVA.
C) Treatment with the ATR inhibitor from tailbud stage causes pericardiac edema, too. Graph displays means ± SEM, n=55-60 embryos in 3 experiments. p=0.0025, Student’s t-test.
D) Live image of a clutch of 48 hpf embryos that had been injected with Atr MO at the one cell stage. Note the large number of embryos displaying an increased body curvature, which is an indicator of a cilia dysfunction.
E) Percentage of embryos with an abnormally curved body. Graph displays mean values ± SEM, n=79-85 embryos in 3 experiments. ** indicates p<0.01, One way ANOVA.
F) Chemical inhibition of Atr (Atri) robustly leads to curved embryos. Results show the mean values ± SEM, n=55-60 embryos in 3 experiments. p<0.0001, Student’s t-test.