Fig. 1
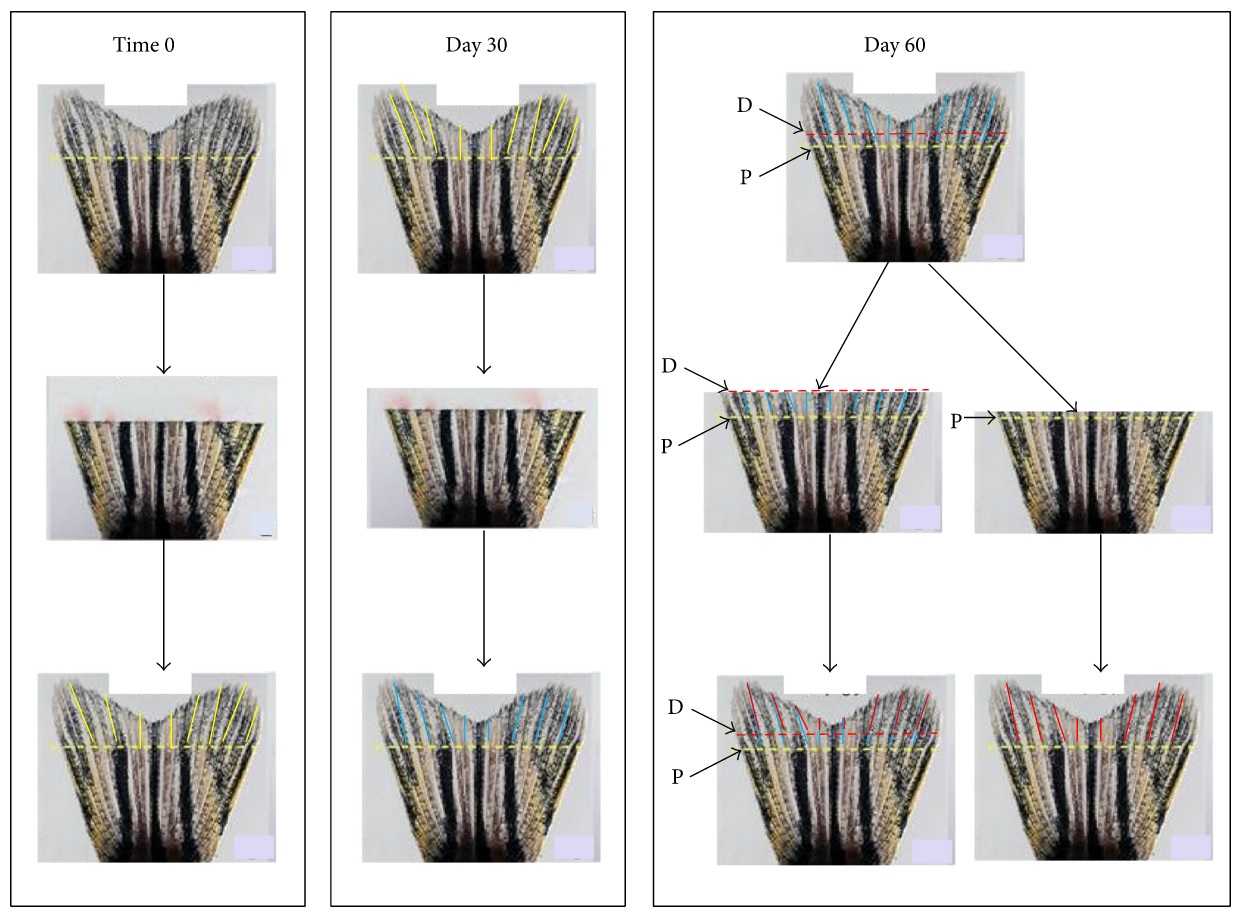
Figure 1: Schematic of amputation scheme employed to generate metabolic memory fin tissue. At Time 0, caudal fins were amputated and allowed 30 days for regrowth (Time 0 panel). At 30 days, the fins were again amputated and allowed an additional 30-day period of regenerative growth (Day 30 panel). This tissue is called metabolic memory tissue as it was generated outside of the hyperglycemic state. At 60 days, the groups were split into two fin sets and were cut either proximally (yellow dashed line, P) or distally (red dashed line, D) [Day 60 panel]. When analyzed for residual ROS and AGE molecules, the growth from the proximal and distal cuts (bottom left side of Day 60 panel, indicated by blue and red bars) had no residual ROS or AGE molecules, while tissue of the original fin (inferior to the proximal cut) did have residual ROS and AGE molecules [2, 3]. Excision of the distal cut growth (red bar area) was used for all DNA methylation sequence analysis and gene expression (microarray) analysis because it was pure metabolic memory region tissue (with no residual molecules from the original hyperglycemic state) and was clearly morphologically distinct from the original hyperglycemic fin tissue (each cut line can be observed in the regenerate fin tissue).

