
|
Fig. S2
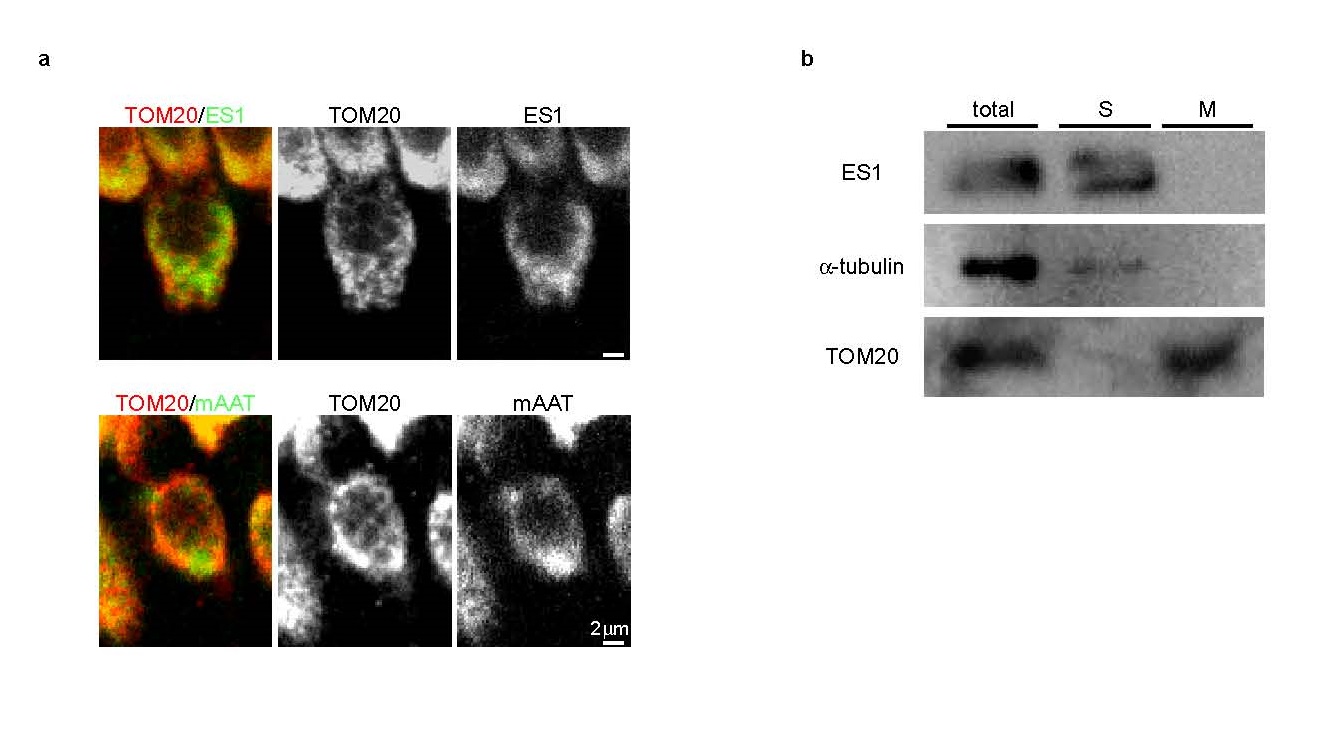
Subcellular localization of ES1 in zebrafish cones. (a) Apparent heterogeneity of immunoreactivities in cone ellipsoid. High magnification views of double immunostainings of cone ellipsoids with TOM20/ES1 antibodies (upper panels) and TOM20/mAAT antibodies (lower panels). TOM20 antibody was used as a mitochondrial outer membrane marker to detect the outline of individual mitochondria. Both ES1- and mAATimmunopositive signals were weaker at apical (upward direction) and central regions of the cone ellipsoids (right panels). In the same regions, TOM20 antibody depicted clear round patches >2 µm in diameter (middle panels), indicating the presence of mega-mitochondria. (b) Subcellular fractionation analysis for ES1. Immunoblotting analysis with anti-ES1 antibodies was performed using fractionated cells from retinas. Anti-alpha-tubulin and TOM20 antibodies were used as a marker for soluble fraction and membrane fraction, respectively. S: soluble fraction, M: membrane fraction.