Fig. 8
Hematopoieticdefects in adult dnmt3bb.1y258 Mutants.
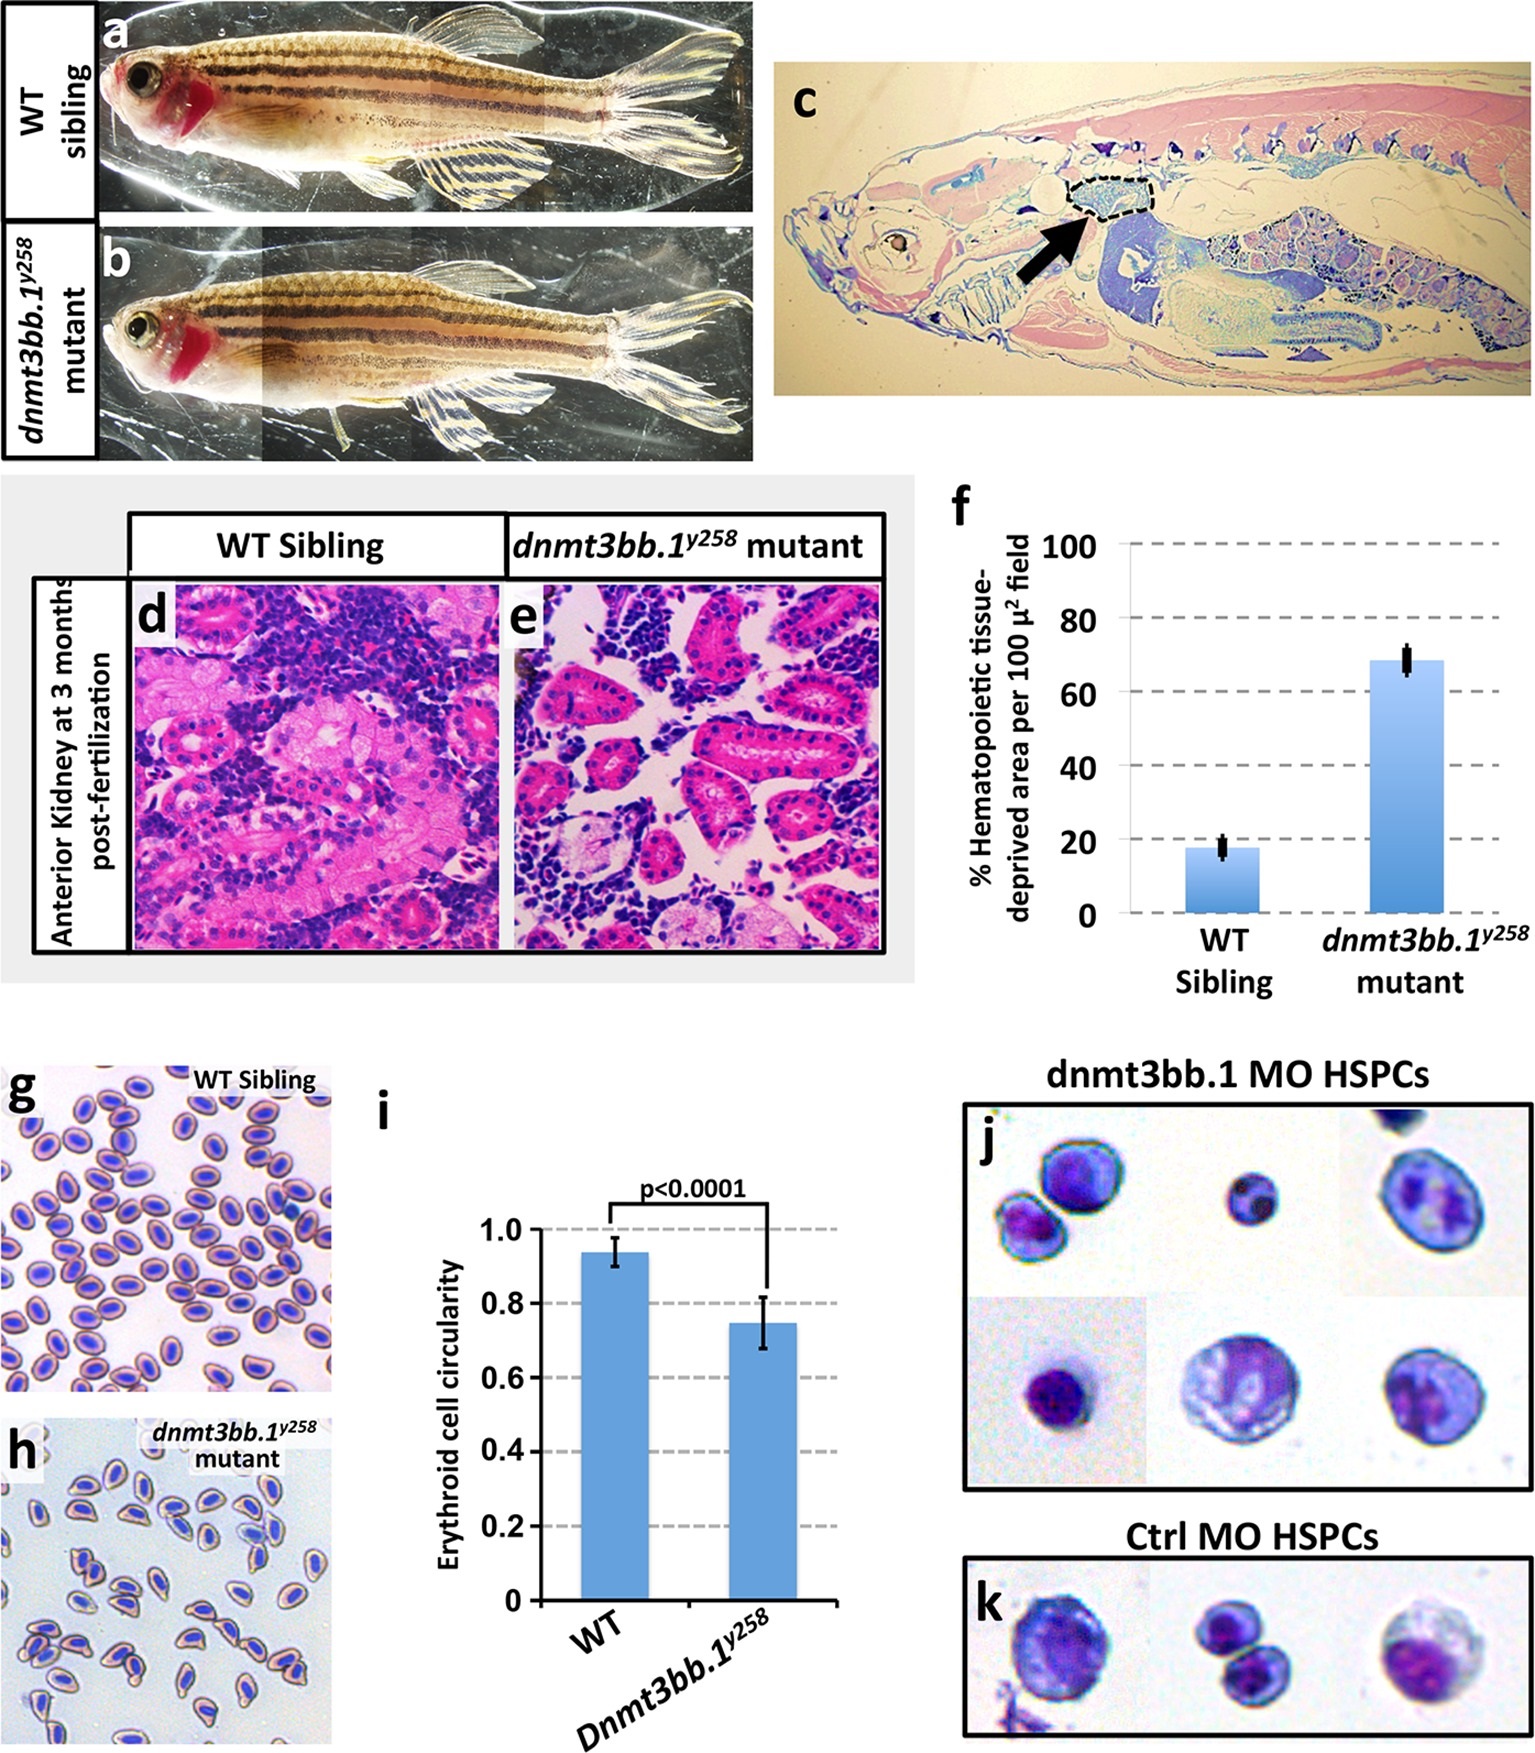
(a,b) Wild type sibling (a) and dnmt3bb.1y258homozygous mutant (b) adult zebrafish. (c) Representative low-magnification sagittal section through a dnmt3bb.1y258 homozygous mutant adult zebrafish, showing the head kidney (marked an arrow and surrounded by a dashed line), a major site of hematopoiesis in adult zebrafish. (d,e) Representative higher magnification images of sagittal sections through the head kidneys of wild type sibling (d) and dnmt3bb.1y258 mutant (e) adult zebrafish, stained with hematoxylin/eosin. (f) quantitation of the percentage of the hematopoietic (non-kidney tubule) area that is acellular in head kidney sections from wild type sibling (left column) and dnmt3bb.1y258 mutant (right column) adult zebrafish. (g,h) Giemsa -stained blood smears from wild type sibling (g) and dnmt3bb.1y258 mutant (h) adult zebrafish. (i) quantitation of the adult erythroid cell circularity in WT and dnmt3bb.1y258 mutant (see Materials and methods), measured from blood smears such as those in panels g and h. (j,k) Giemsa stained FACS-sorted HSPC (as in Figure 3a) from 36 hpf dnmt3bb.1 (j) or control (k) morpholino-injected zebrafish.

