Fig. 1
Fig. 1
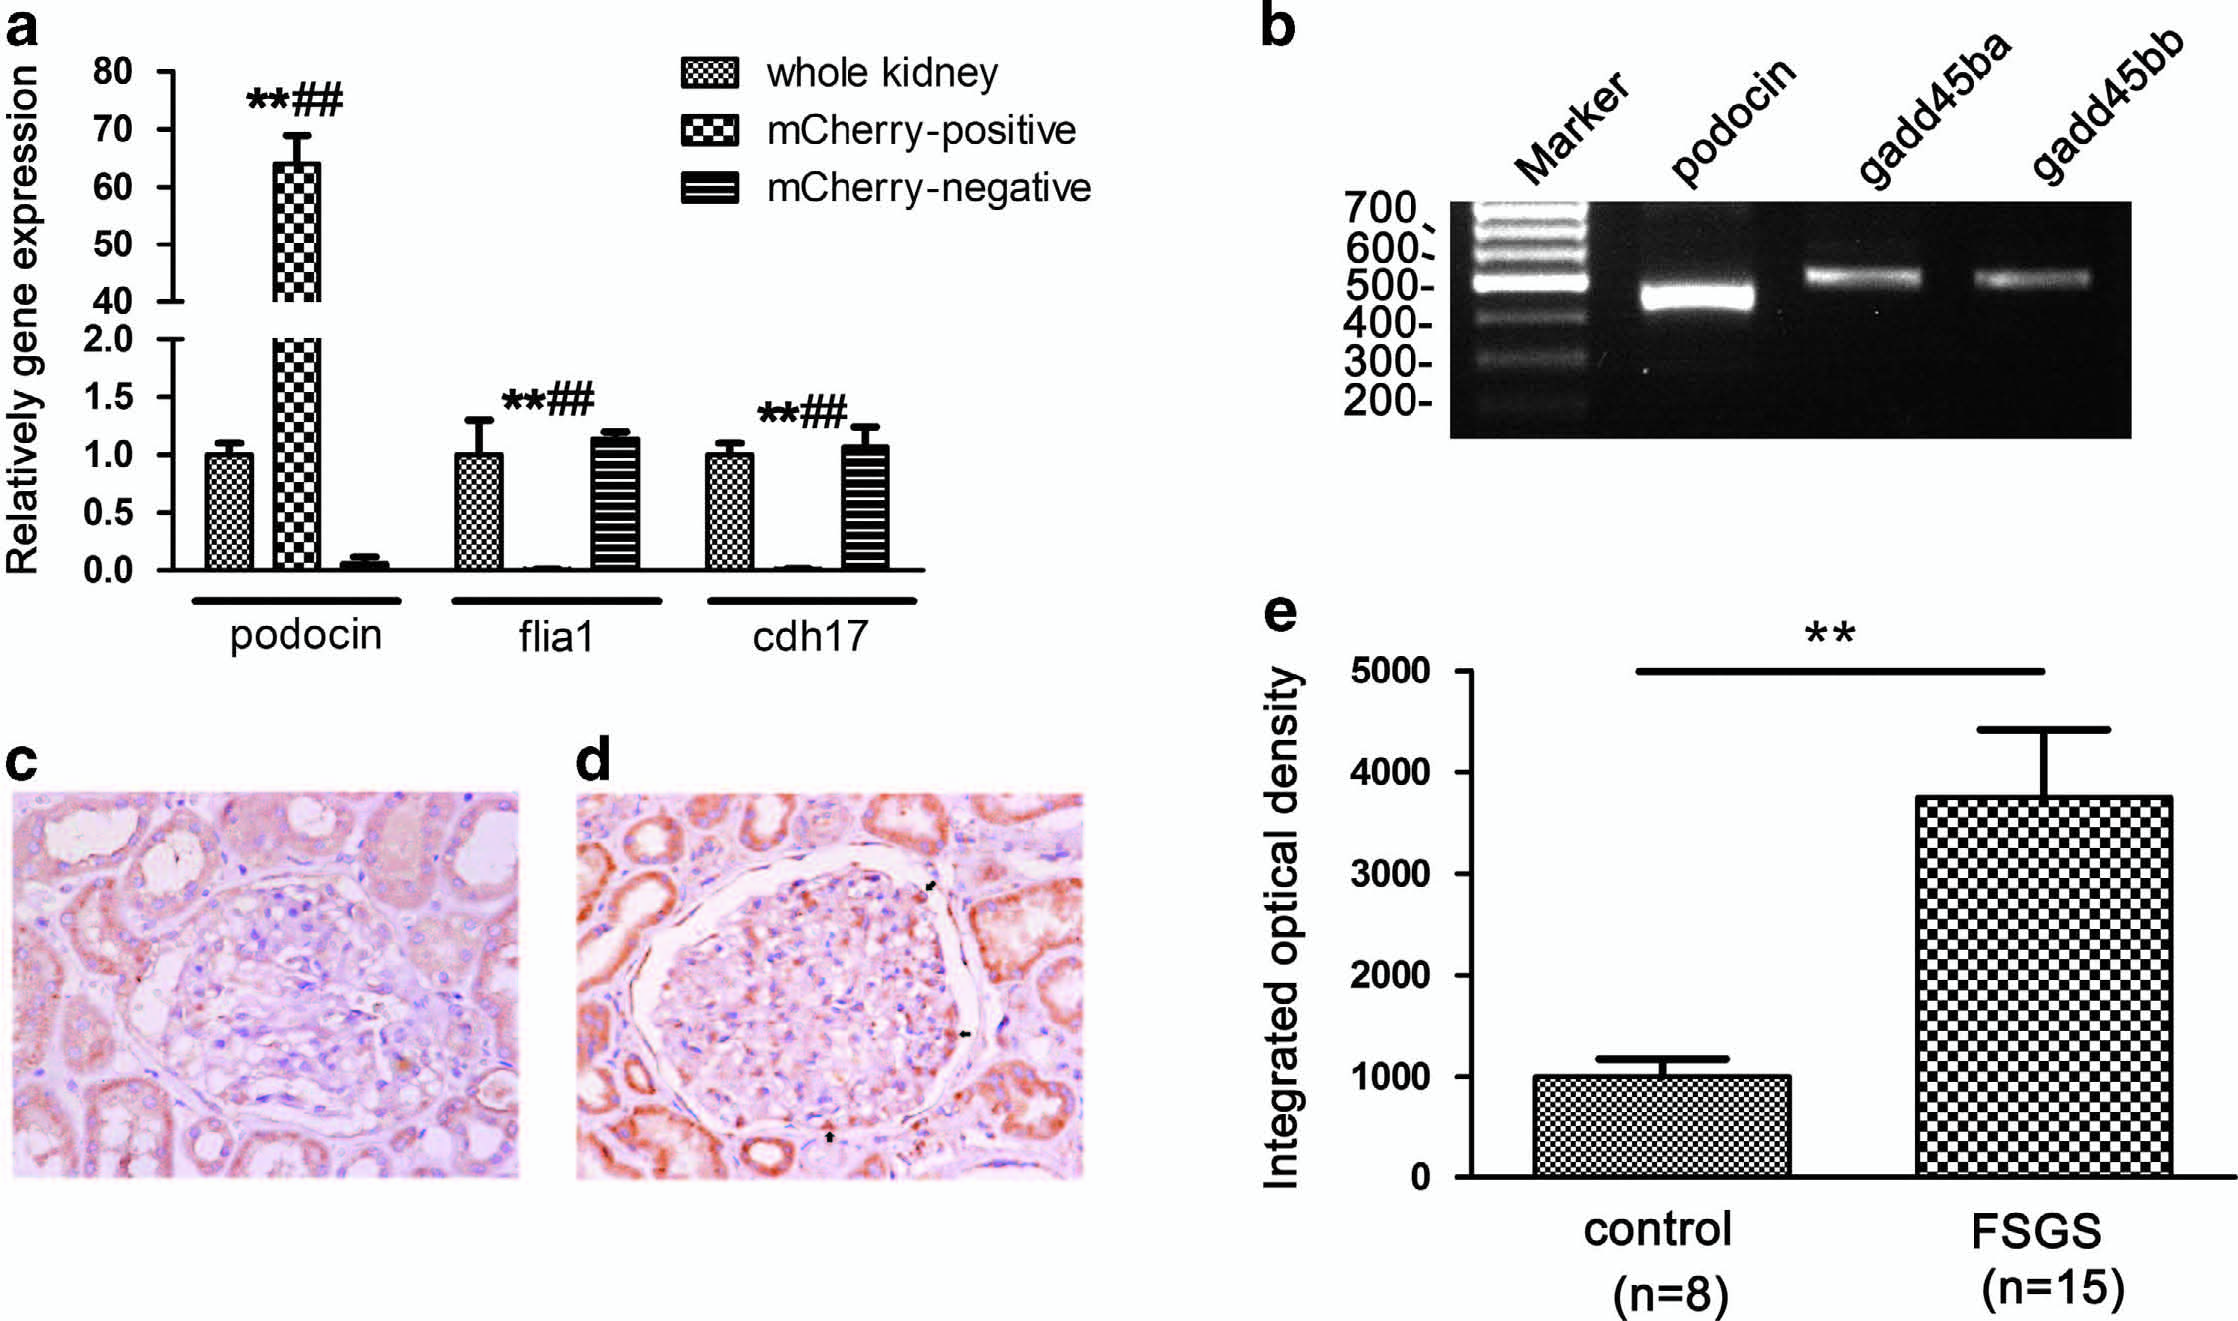
Validation of gadd45ba/bb expression on podocyte. (a) qRT-PCR validation of isolated podocytes. qRT-PCR analysis confirmed that the expression of podocyte marker podocin in isolated podocytes (mCherry positive) was highly enriched as compared with those from whole kidney and mcherry-negative cells. In contrast, expression of endothelial marker flia1 and tubular marker cdh17 were significantly lower in isolated podocytes as compared with those in whole kidney and mCherry-negative cells. Results are represented as mean±S.D. (n=3), **P<0.01 compared with whole kidney, ##P<0.01 compared with mcherry-negative cells. (b) RT-PCR analysis of gadd45ba/bb mRNA expression in isolated podocytes. gadd45ba/bb expressed in isolated podocytes which express podocin (c, d) GADD45B expression in biopsy of normal control (c) and FSGS patient (d) by immunohistochemical staining. GADD45B signals are very weak in glomeruli of normal kidney tissues, whereas GADD45B expression in FSGS patients was significantly increased as compared with normal control group. Arrows indicate GADD45B expression on podocytes of FSGS patient. Original magnification × 400 (e) Semiquantitative analysis of immunohistochemical staining results showed GADD45B expression of glomeruli of FSGS patients were significantly higher than the control group. Results are represented as mean±S.D. **P<0.01

