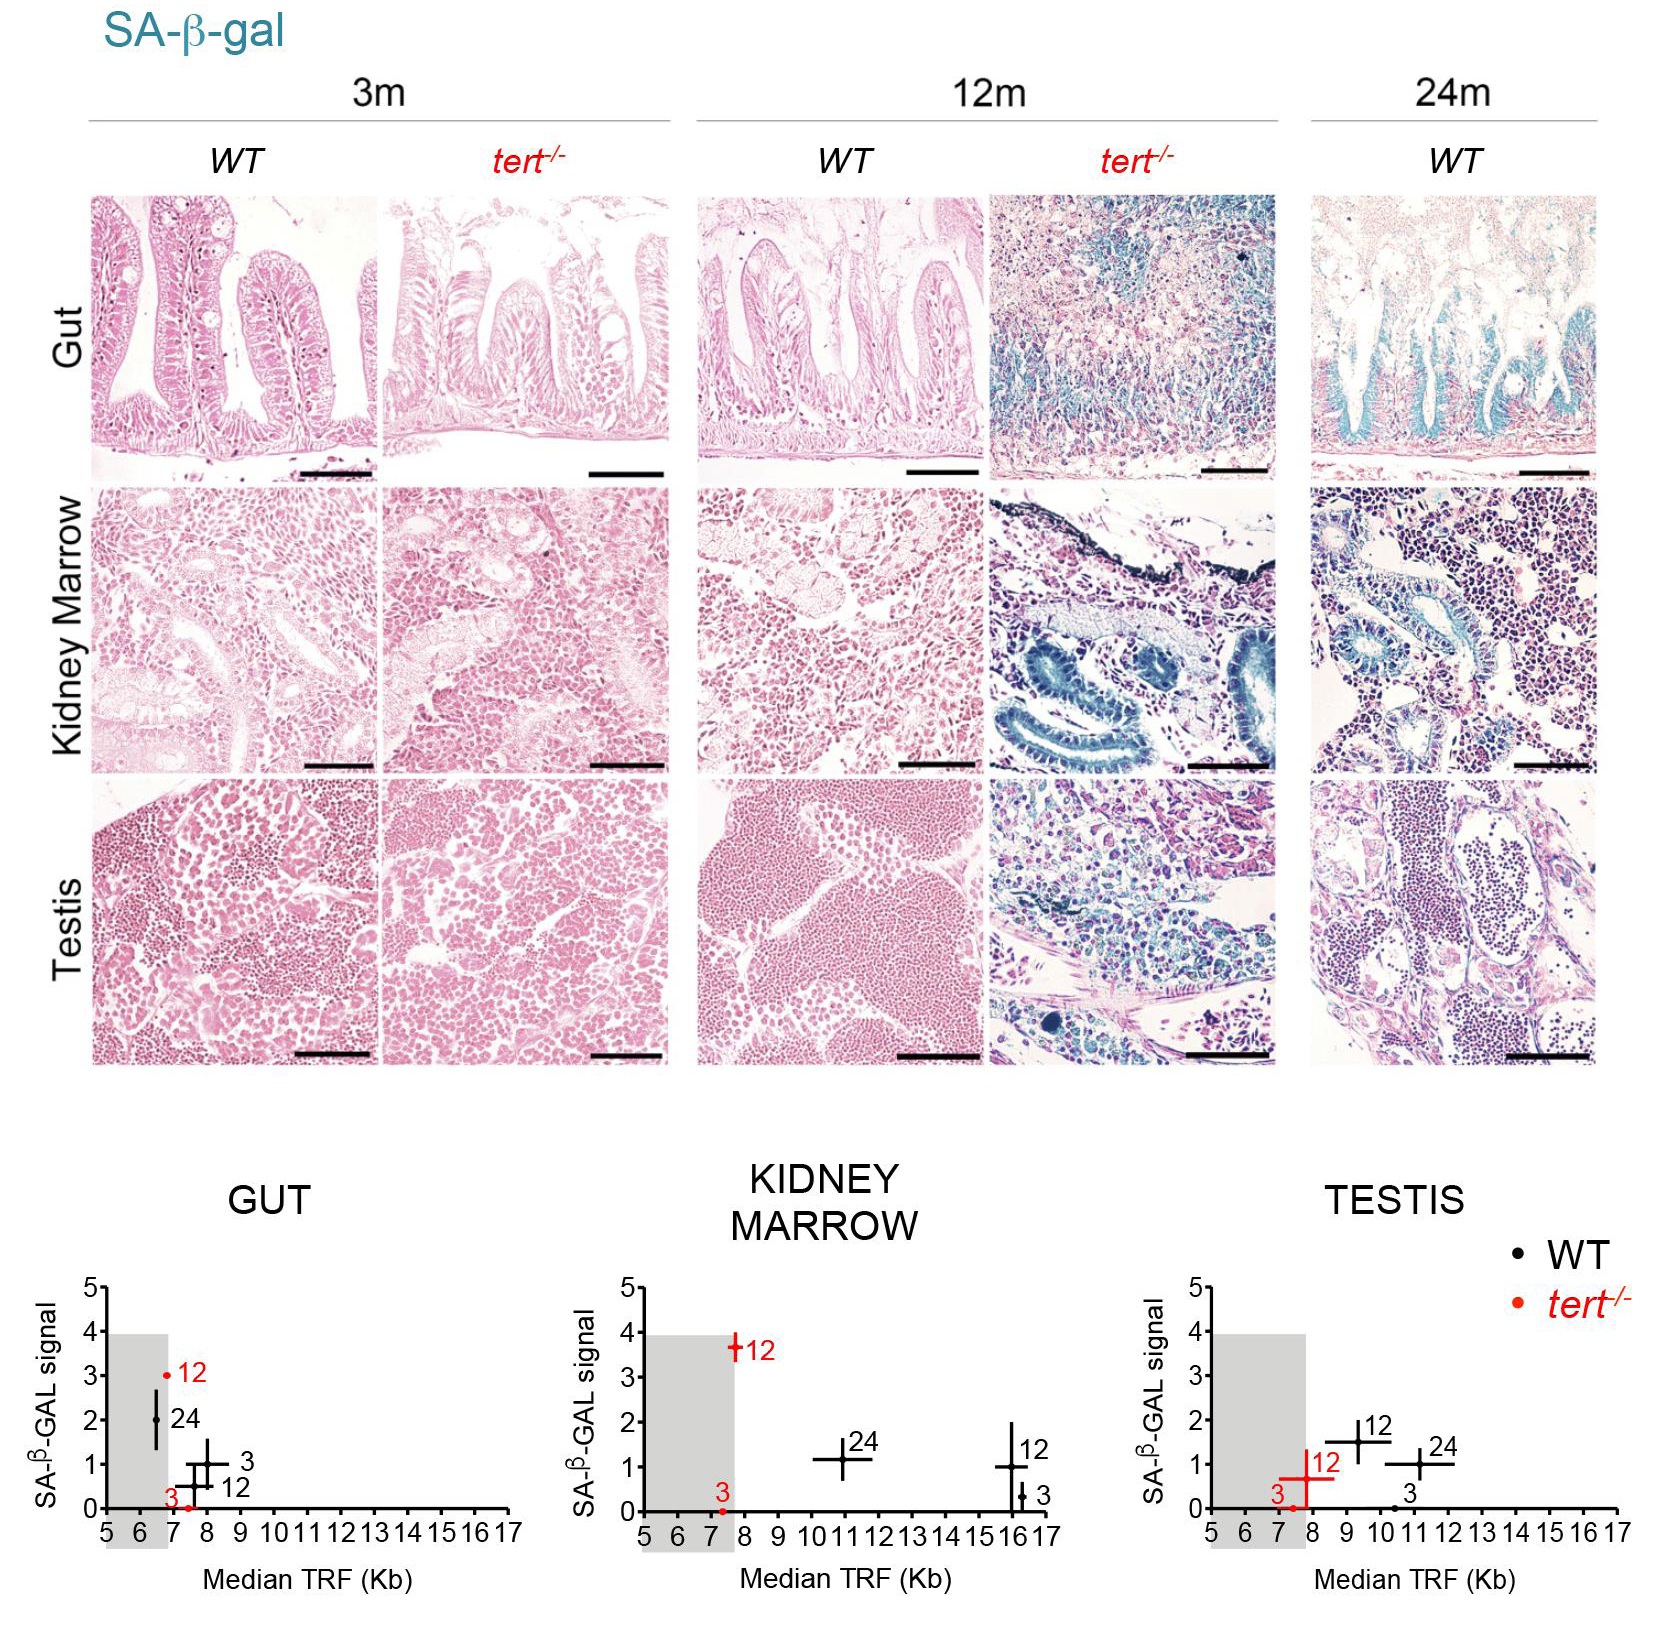
Fig. S6
Increase in senescence with age is anticipated by shorter mTL.A) Representative haematoxylin-eosin and senescence-associated β-galactosidase (SA-β-gal) staining in gut, kidney marrow and testis sections of WT (at 3, 12 and 24 months) and tert-/- mutant siblings (at 3 and 12 months). A significant increase in SA-β-gal positive cells is seen by 12 months of age in tert-/- tissues and by 24 months in WT tissues (when comparing both with 3 month-old controls). No staining is observed in the muscle. B) Increase in SA-β-gal staining does not significantly correlate with mTL decline in any of the tissues tested. Grey shaded area identifies the telomeric length at which significant SA-β-gal staining is observed in tert-/- mutants’ tissues. WT and tert-/- age groups are indicated in each graph by black and red colored numbers, respectively. Quantifications of SA-β-GAL signal were performed using an arbitrary scale of signal intensity (where weaker signal is represented by 1 and stronger signal by 4). N = 3–6 per genotype per time point. Scale bar = 50 µm. N = 3–6 for tissue mTL telomere length quantifications per genotype per time point (x-axis in graphs of S6B Fig). Data are represented as mean +/- SEM.

