
|
Fig. S22
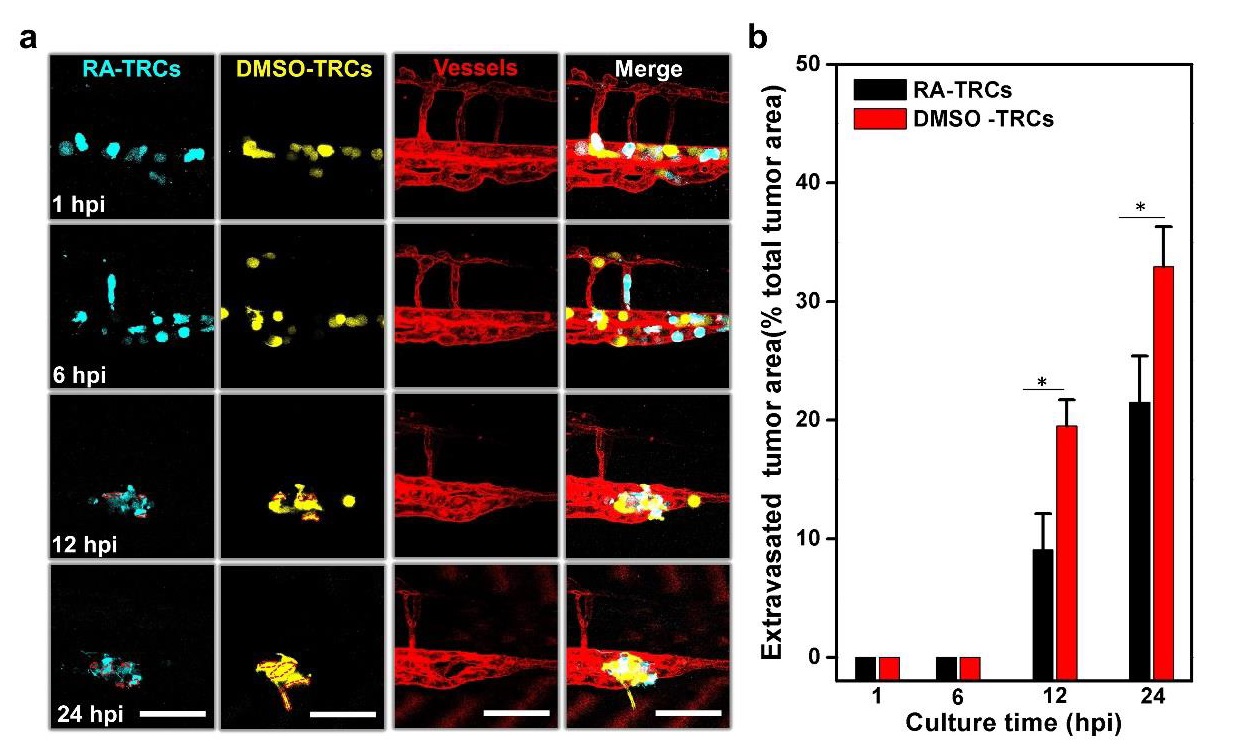
Differentiation of TRCs with retinoic acid inhibits extravasation of TRCs in vivo. (a) TRCs treated with retinoic acid (RA, 10 µM) or DMSO (0.1%) for 12 hrs were transfected with pECFP-N1 and pEYFP-N1 respectively. The cells were mixed and co-injected at 1:1 ratio into the pericardium of 48 hpf embryos. Images in the first two panels show penetration area of RA-TRCs (left panels) or DMSO-TRCs (right panels) at 1, 6, 12, and 24 hpi respectively, and the next two panels show zebrafish vessels and merges respectively. Dashed red lines mark the tumor extravasation areas (i.e., various sizes of micrometastases) from vessels to surrounding tissues. Scale bars, 100 µm. (b) Quantification of extravasated tumor area relative to the total tumor area at different time points: 1, 6, 12, and 24 hpi. Color code: Zebrafish blood vessels are red, RA-TRCs are cyan, and DMSO-TRCs are yellow. DMSO-TRCs exhibit higher penetration rates than RA-TRCs. Mean±s.e.m.; n>6 fish per group; ≥3 independent experiments. *p< 0.05.