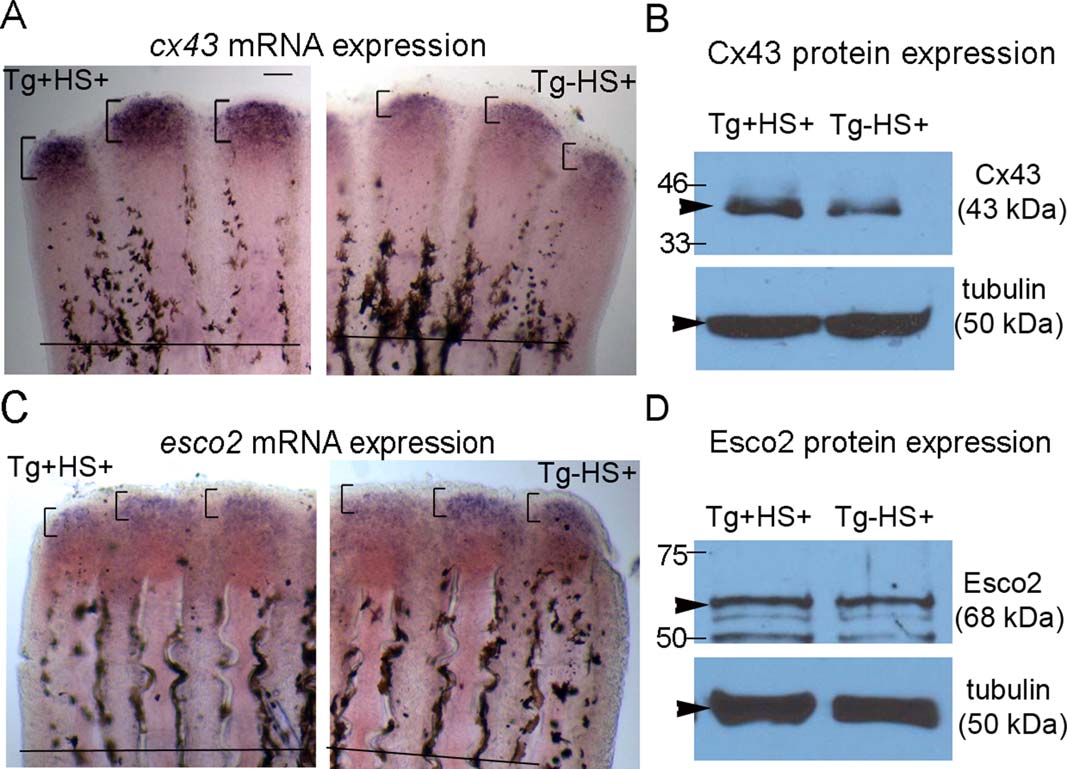
Fig. 11
Up-regulation of both cx43 mRNA and Cx43 protein in regenerating fins of the transgenic line treated for heat shock. A: Expression of cx43 mRNA in transgenic hsp70:miR-133sp pd48-positive with heat shock (Tg+HS+) and hsp70:miR-133sp pd48-negative with heat shock (Tg-HS+) fins by whole-mount ISH. The Tg+HS + fins show a higher expression of cx43 mRNA compared with Tg-HS + fins. The brackets mark the zone of cx43 expression in each fin ray and the horizontal line represents the amputation plane. Scale bar = 50 µm. B: Western blot reveals a 50% increase of Cx43 protein levels (normalized to tubulin) in fin lysates of Tg+HS + compared with Tg-HS+. Tubulin was used as a loading control. The bands marked were used for relative band intensity analysis using the gel analysis tool (ImageJ software). C: Expression of esco2 mRNA in transgenic hsp70:miR-133sp pd48-positive with heat shock (Tg+HS+) and hsp70:miR-133sp pd48-negative with heat shock (Tg-HS+) fins by whole-mount ISH. Tg+HS + and Tg-HS + fins show similar expression level of esco2 mRNA. The brackets mark the zone of esco2 expression in each fin ray and the horizontal line represents the amputation plane. Scale bar = 50 µm. D: Western blot reveals the Esco2 protein expression (normalized to tubulin) is nearly similar (90%) in fin lysates of Tg+HS + and Tg-HS+. Tubulin was used as a loading control. The single band marked was used for relative band intensity analysis using the gel analysis tool (ImageJ software).

