
|
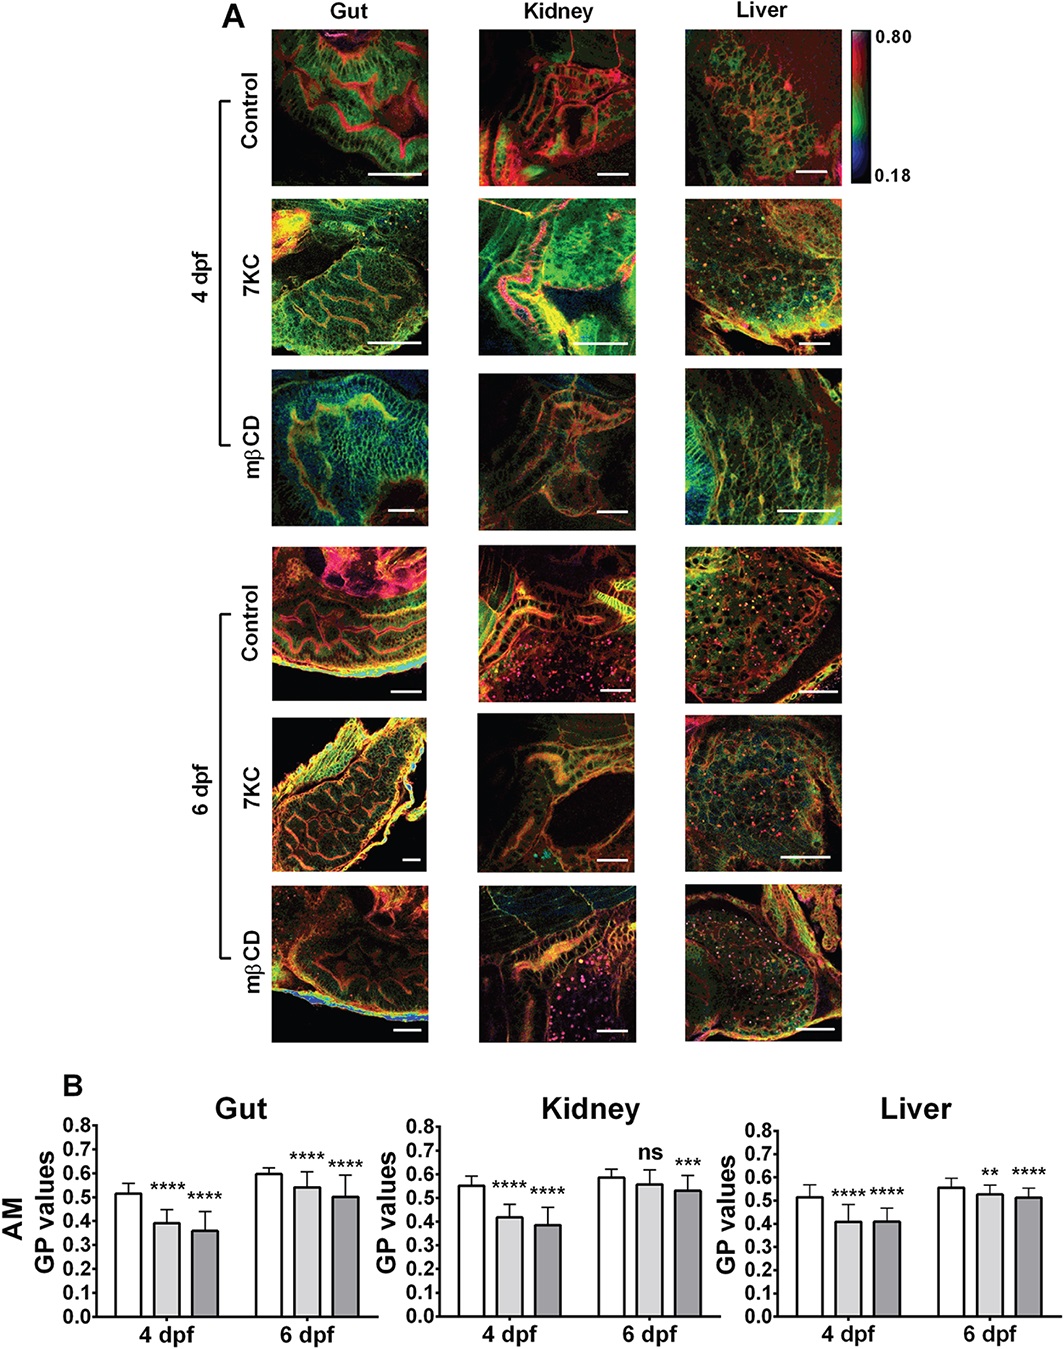
Fig. 4
Recovery of membrane order after sterol modification. Four dpf larvae were left untreated (Control), enriched in 7KC (100 µm, 30 min) or depleted of cholesterol with methyl-β-cyclodextrin (mβCD, 2.5 mm, 40 min) as described in Figure 3, and either imaged and analyzed at that stage (A) (4 dpf) or allowed to develop to 6 dpf. B) GP values quantified for apical membrane (AM) of epithelial cells in the gut, kidney and liver at 4 dpf and 6 dpf. In (A), scale bar = 20 µm. In (B), data are mean and standard deviations from 50 regions in 10 larvae corresponding to the apical membranes (AM). **p < 0.01; ***p < 0.001 and ****p < 0.0001 relative to corresponding data at 4 pdf and 6 dpf (Student t-test).