
|
Fig. 1
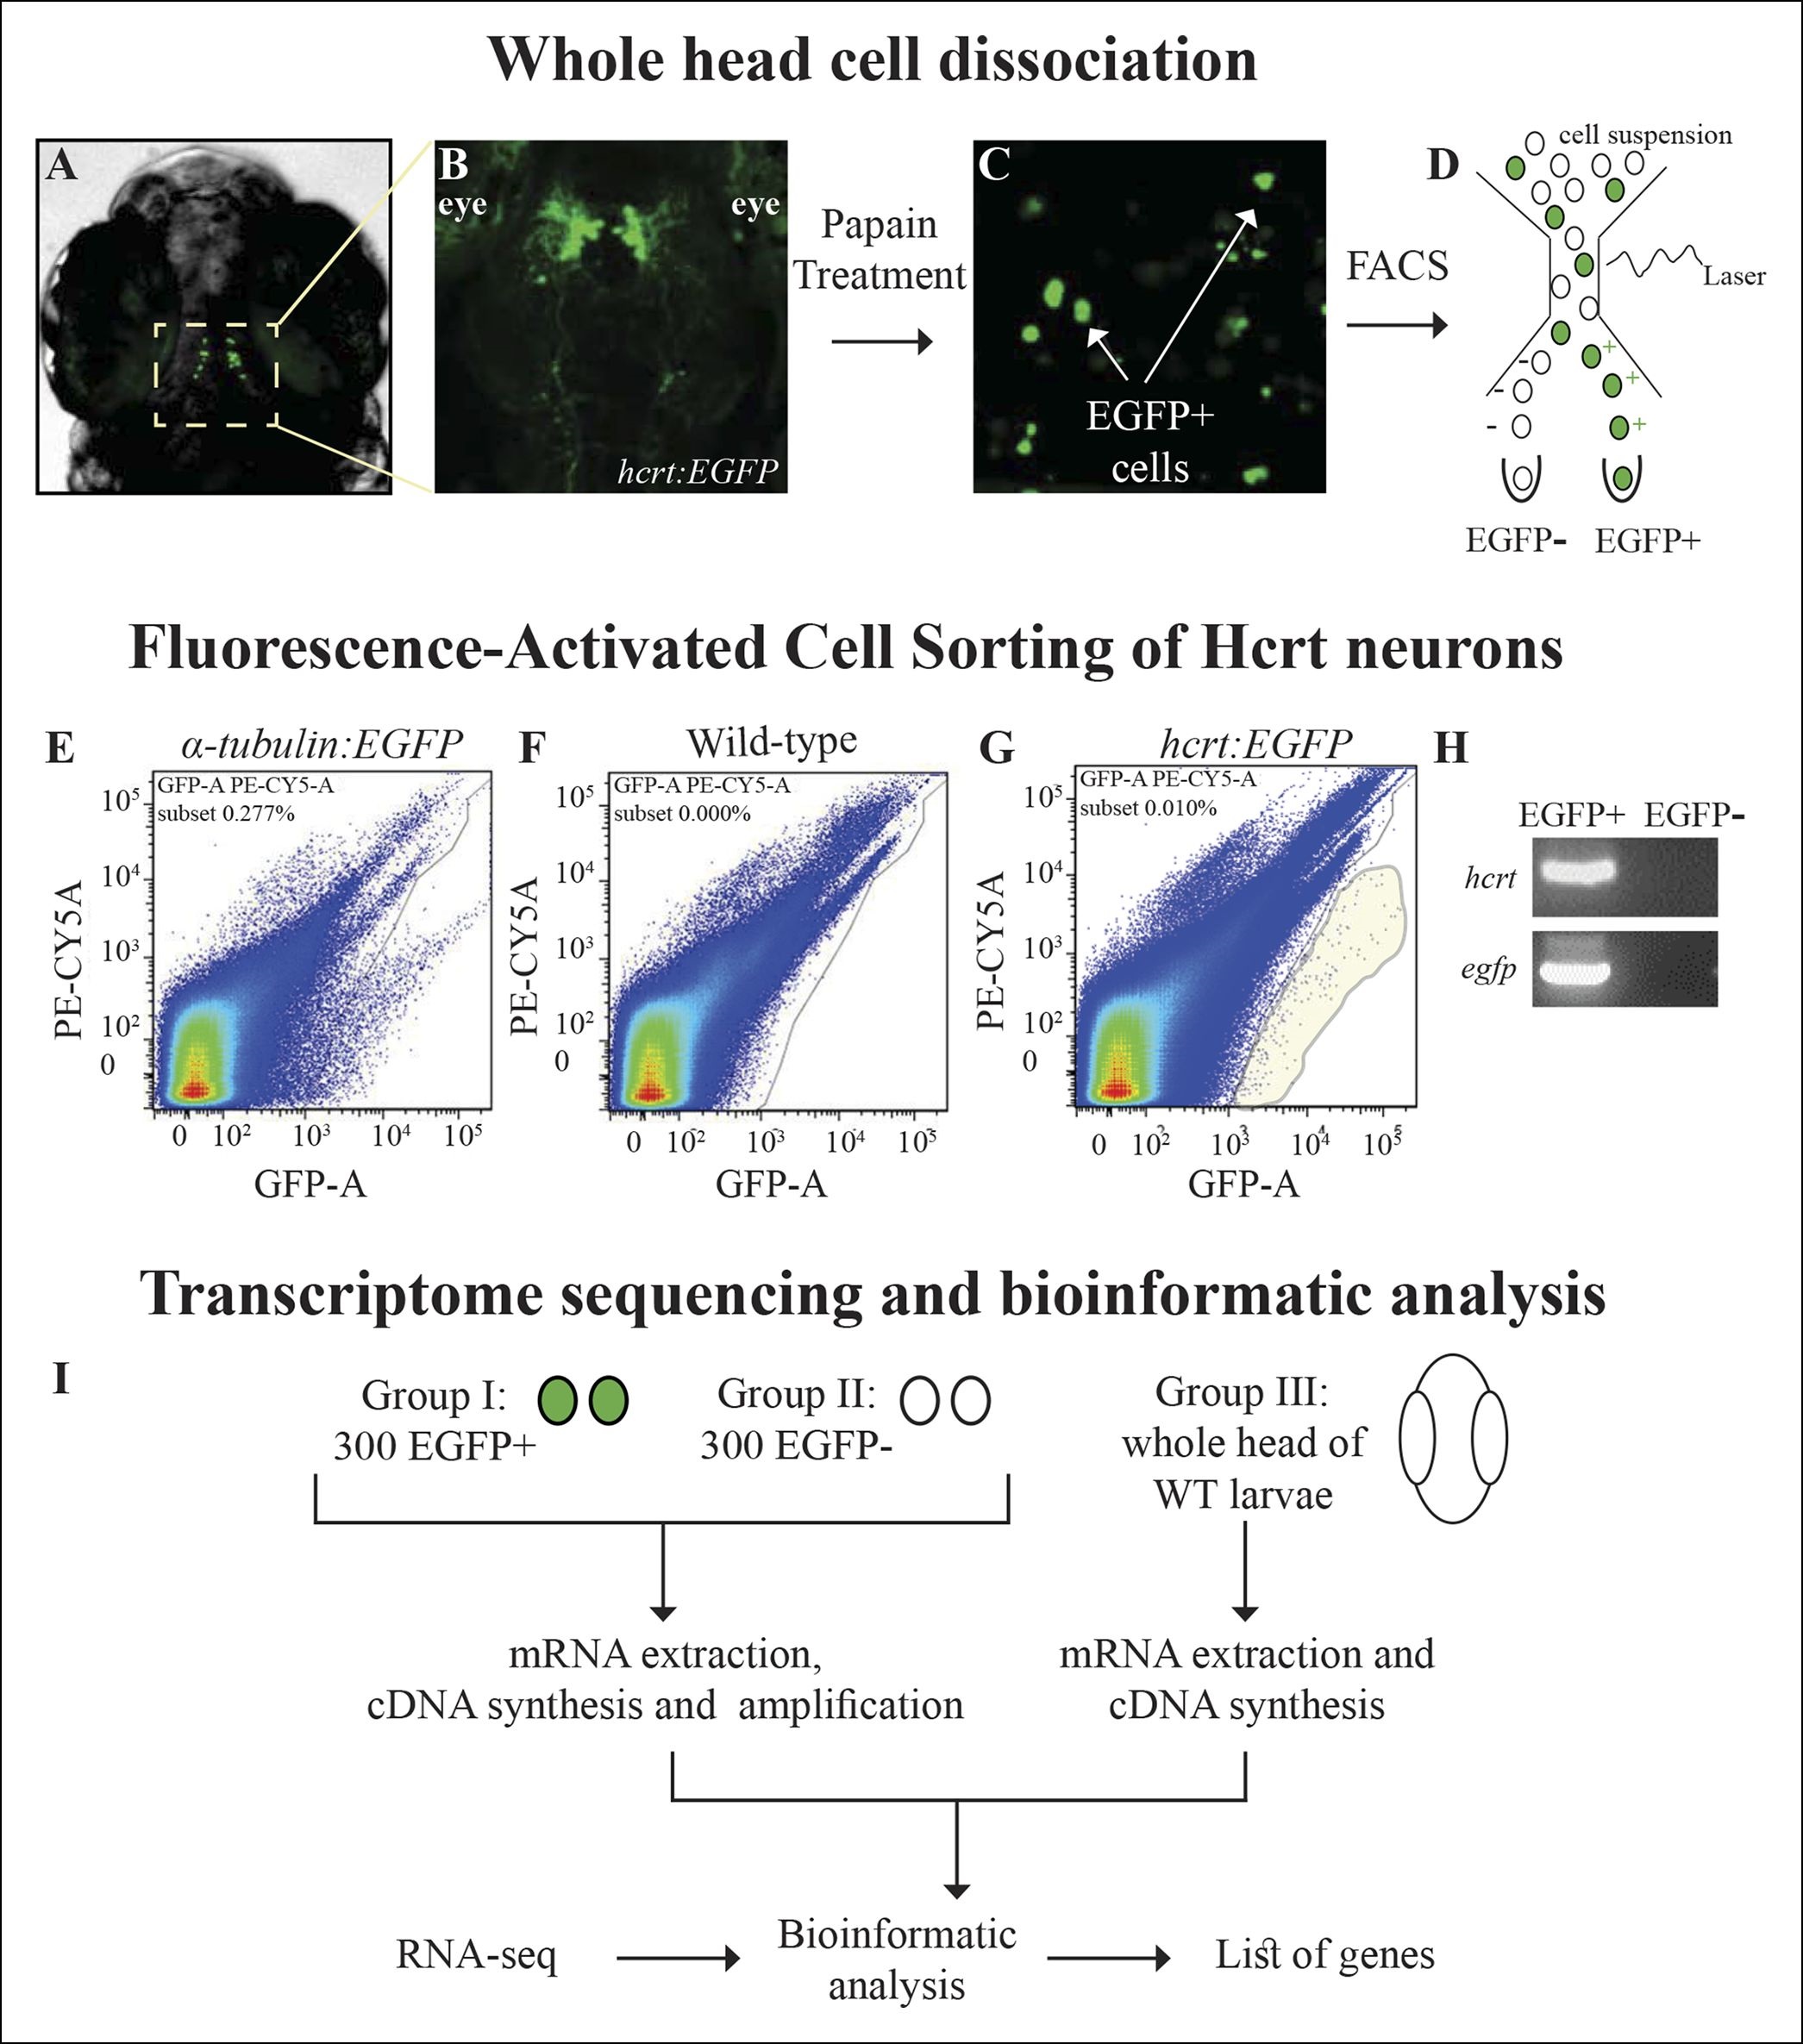
Isolation of Hcrt neurons, RNA-seq, and experimental design.
(A) Dorsal view of 6 dpf hcrt:EGFP larvae. (B) Dorsal view of the hypothalamus region of 6 dpf hcrt:EGFP larvae expressing EGFP in Hcrt neurons. (C) Cell suspension from the whole head of 6 dpf hcrt:EGFP larvae. (D–G) The cells were sorted based on size and fluorescence intensity. The fluorescence thresholds (gray curve) were set based on larvae expressing EGFP under the control of α-tubulin promoter (positive control) (E) and WT larvae (negative control) (F). Positive EGFP cells (EGFP+) sorted from hcrt:EGFP larvae are marked with gray shade (G). (H) PCR amplification of hcrt and egfp was performed on cDNA synthesized from EGFP+ and EGFP- cells sorted from hcrt:EGFP larvae. (I) FAC-sorting yielded two groups of cells: Group I containing EGFP+ and Group II containing EGFP- cells. A third group contained cells from whole head of WT larvae. The cDNA of groups I and II was amplified and the three groups were then subjected to RNA-seq and bioinformatic analysis to obtain a list of Hcrt-neuron–enriched genes.